

 PDF
PDF ePub
ePub Citation
 Print
Print


Introduction
Aortic stenosis (AS) is the most common valvular heart disease in developed countries. It is associated with high morbidity and mortality without treatment, and the prevalence increases as a function of the aging population.1) Two-dimensional (2D) transthoracic echocardiography (TTE) is the standard method of severity evaluation. Severe AS is historically defined as aortic jet velocity >4.0 m/s, mean Doppler gradient (MG) >40 mmHg, or aortic valve area (AVA) <1.0 cm2.2) These cutoffs are based on previous studies of aortic stenosis without surgical intervention. Recent guidelines have deemphasized AVA, but it remains an important metric of severity.3)
Prior studies indicate that up to 35% of cases of severe AS have paradoxical low flow, low gradient despite preserved left ventricular ejection fraction (EF).4) This entity is defined based on AVA <1 cm2 of severe AS with mean Doppler gradient <40 mm Hg in the setting of a stroke volume index (SVI) ≤35 mL/m2 and normal left ventricular EF ≥0.50.4) Left untreated, individuals with paradoxical low flow, low gradient (PLFLG) severe AS may have higher mortality than those with conventionally defined severe AS.4) Thus, differentiating patients with this condition from those with erroneous metrics of severity is imperative.
Error in measurement of left ventricular outflow tract (LVOT) diameter is a potential source of error in AVA calculation.5) AVA estimation by echocardiography utilizes the continuity equation: AVA=(cross sectional area [CSA]LVOT x time velocity integral [TVI]LVOT)/TVIAV, where CSALVOT is the LVOT cross-sectional area, TVILVOT the time-velocity integral of outflow tract flow, and TVIAV the time-velocity integral of aortic valve flow. LVOT is the least reliable variable in the continuity equation for AVA with compounding of error due to squaring of the length measurement.6) Therefore, we hypothesized that LVOT measurement by 2D transesophageal echocardiography (TEE) would be more accurate in some cases due to better visualization of and alignment with the LVOT.2) This could result in the reclassification of some cases to non-severe AS on the basis of a larger LVOT measurement.
Subjects and Methods
Study population
The study population consisted of subjects aged >18 years referred to the Mayo Clinic Arizona echocardiography laboratory between 1/1/1998 and 2/19/2013 with findings of severe AS based on AVA <1.0 cm2 by TTE. Subjects with LVEF <0.50 were excluded. All referrals who underwent TEE for any indication within 6 months of the transthoracic study were also included. Finally, 80 patients were included.
Demographics
Basic demographic data on all subjects was obtained by retrospective review of clinical charts. Pertinent available demographics and comorbid conditions including age, gender, body mass index (BMI), systolic and diastolic blood pressure (BP), heart rate (HR), diabetes mellitus (presence of), systemic hypertension, hyperlipidemia, coronary artery disease, chronic kidney disease, atrial fibrillation, and congestive heart failure were recorded.
Echocardiography
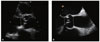
Archived transthoracic and transesophageal studies for each patient were reviewed by a single echocardiographer (MMA) who was blinded to previously recorded measurements. Two-dimensional transthoracic and transesophageal LVOT diameter measurements were performed separately to ensure blinding to results of the other modality. TTE was performed using one of several commercially available echocardiography systems and a 1-3 MHz transducer with standard views and techniques as recommended by the American Society of Echocardiography (ASE). The LVOT was imaged in zoom mode in the parasternal long axis view using harmonic imaging. Gain was adjusted to optimize the blood tissue interface. As recommended,2) LVOT diameter was measured in mid-systole from inner edge to inner edge just below the insertion of the AV leaflets (Fig. 1A). TEE was performed using one of several commercially available echocardiography systems and a 4-7 MHz probe; the LVOT was imaged in zoom mode in the mid-esophageal long axis view (typically ~ 130 degrees) during mid-systole from inner edge to inner edge (Fig. 1B).
Other available standard B-mode and Doppler measurements were obtained from the existing echocardiography reports. Of note, all Doppler parameters for atrial fibrillation were averaged over 5 to 10 cardiac cycles. Left ventricular EF was based on the TTE study. Intraobserver and interobserver (echocardiographer AP) variability were assessed by repeating LVOT diameter measurements 2 months after the initial analysis in 20 consecutive patients. AVA was calculated by the continuity equation utilizing LVOT measurements from TTE or TEE and Doppler data from TTE, including LVOT TVI.
Physiologic parameters
Energy loss index (ELI) was calculated using the validated equation AVAxAa/(Aa-AVA)/m2, where Aa is the aortic area at the level of the sinotubular junction and m2 is the body surface area.7) Valvuloarterial impedance (Zva) was calculated as (systolic arterial pressure [SAP]+MG)/SVI, where SAP is the systolic arterial pressure.8)
Statistical analyses
All analyses were performed using JMP version 10.0 (SAS Institute Inc., Cary, NC, USA). Continuous variables were reported as mean±standard deviation. Student's t-test and two-way analysis of variance (ANOVA) were used for continuous variables. Pearson's chi-square contingency test was used to compare categorical variables. Multiple linear regression analysis was used to model the relationship between ≥2 explanatory variables. A p value of <0.05 was considered statistically significant. Intra-and-interobserver reliability was calculated utilizing the concordance correlation coefficient. The Bland and Altman method was used for differences in paired measurements. Data were reported with a 95% confidence interval (CI) estimate, and all reported p values were 2-sided. The study protocol was approved by the Institutional Review Board of the Mayo Clinic.
Results
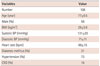
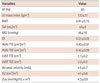
Demographics and clinical characteristics of all the patients with severe AS and normal EF by TTE were shown in Table 1. The patients tended to be elderly, male, and overweight with high prevalence of systemic hypertension. There were 16 bicuspid aortic valves and 1 unicuspid valve. The remaining cases with available classification information were of calcific etiology. Sixty-two (78%) patients were in sinus rhythm at the time of the studies; and the remaining patients were in atrial fibrillation, atrial flutter, or an unspecified rhythm. The optimal acquisition window for peak AS velocity by TTE was either apical or right parasternal. Echocardiographic parameters are shown in Table 2. Of 108 patients with severe AS by TTE, 14 (13%) were reclassified as moderate AS on the basis of LVOT diameter measurement by TEE, resulting in an AVA of 1.0-1.5 cm2. Of 80 patients with severe AS by TTE and preserved LVEF, 10 (13%) were reclassified to moderate AS by TEE. In addition, of 27 subjects with severe AS by TTE with low gradient despite preserved LVEF, 5 (19%) were reclassified as moderate AS by TEE. The remaining 53 subjects had severe AS by conventional criteria (AVA <1 cm2 and MG >40 mmHg) and normal LVEF.
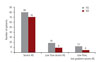
Based on TTE measurements, 19 patients had severe AS with low flow (SVI ≤35 mL/m2) despite preserved LVEF. Of these, 3 patients were reclassified as moderate AS by TEE measurement of LVOT. An additional 7 patients had normal flow using TEE measurement of LVOT (without modifying the TTE measurement of LVOT TVI) and recalculation of SVI. Hence, a total of 10 (53%) patients were reclassified as either moderate AS or severe AS with normal flow. Twelve patients (11% of the initial study population with severe AS) met the TTE criteria for paradoxical low flow, low gradient severe AS despite preserved LVEF. Three patients were reclassified as moderate AS by TEE measurement of LVOT diameter (AVA 1.0-1.5 cm2). An additional 4 patients had normal flow by TEE. Therefore, a total of 7 (58%) patients were reclassified, and only 5 patients (4.6% of the initial study population) had low flow, low gradient severe AS by TEE (p<0.001) (Fig. 2).
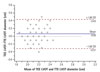
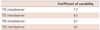
Coefficients of variability for intraobserver and interobserver measurement of LVOT were <10% (Table 3). However, the limits of agreement between TTE and TEE measurement of LVOT ranged from 0.43 cm (95% CI: 0.36 to 0.5) to -0.31 cm (95% CI: -0.38 to -0.23) (Fig. 3). The coefficient of correlation was 0.52. In the entire study population of patients with severe AS, the mean LVOT diameter by TTE was 2.13±0.16 cm and mean LVOT diameter by TEE was 2.19±0.21 cm. The mean and absolute median differences were 0.059 cm (p=0.007) and 0.1 cm, respectively. In the PLFLG severe AS group only, LVOT diameter tended to be higher by TEE, without statistical significance (p=0.07). This may explain the reclassification of AS on using TEE measured LVOT. Among the available clinical and echocardiographic variables, only BMI (p=0.006) and BSA (p=0.04) were significant predictors of discrepancy in LVOT measurement between TTE and TEE. For cases where the difference in LVOT measurement exceeded the median, only BMI (p=0.03) remained predictive.
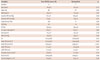
The results were unchanged with use of indexed aortic valve area (AVA/body surface area) in the analysis. Clinical and echocardiographic characteristics of patients with true PLFLG severe AS and those reclassified as either moderate or normal flow, severe AS are shown in Table 4. Although the difference was not significant due to sample size, patients with true PLFLG tended to have higher mean peak AV velocity. Similarly, a trend towards higher MG and smaller dimensionless index (DI) was observed in the true PLFLG severe AS group.
An ELI of <0.6 cm2/m2 is proposed as a cutoff for severe AS,7) and Zva ≥4.5 mm Hg/mL/m2 reportedly predicts poor outcomes in patients with severe AS.8) In the present study, the mean ELI for patients with PLFLG severe AS confirmed by TEE was smaller and the mean Zva larger than for patients reclassified as either moderate AS or normal flow severe AS. Moreover, all confirmed cases of PLFLG severe AS by TEE met the low ELI cutoff for severe AS proposed by Garcia and colleagues, in contrast to those reclassified as moderate AS. Similarly, all TEE-confirmed cases of PLFLG severe AS cases met the high Zva cutoff proposed by Hachicha and colleagues, in contrast to those reclassified as moderate AS.
Discussion
The main findings of this study can be summarized as follows: (1) TEE measured LVOT diameter resulted in the reclassification of severe AS to moderate AS in some patients, on the basis of AVA; (2) prevalence of true paradoxical low flow, low gradient (PLFLG) severe AS was low in this single center study when using TEE measured LVOT diameter; (3) thus, TEE may be considered prior to high-risk intervention for PLFLG severe AS despite preserved EF.
Although multimodality imaging has improved our understanding of LVOT geometry, AS is primarily assessed echocardiographically.3) This issue is increasingly explored for transcatheter aortic valve implantation (TAVI), with multiple studies addressing preprocedural multimodality assessment of the aortic annulus diameter.9)10) Despite the fundamental assumption that the LVOT is circular, differing aortic valve leaflet geometry can lead to variable measurements.11) Specifically, ellipticity of the LVOT reportedly results in underestimation of AVA by echocardiography.11) Moreover, poor echocardiographic image quality and heavy calcification with secondary acoustic blooming can decrease accuracy of measurements.10)
To our knowledge, this is the first study examining 2D TTE and TEE measurement of LVOT diameter for reclassification of severe AS, and specifically, paradoxical low flow, low gradient severe AS despite preserved left ventricular ejection fraction. Our results indicated that LVOT diameter by TEE is slightly higher than by TTE. Prior studies have demonstrated superior correlation of TEE (both 2D and three-dimensional [3D]) compared to TTE with direct aortic valve sizing (during both surgical and transcatheter AVR).10)12) A prior study reported better correlation between 2D TEE and TTE LVOT diameter measurement.13) However, the patients in the present study were older and had higher severity of AS. Therefore, the more heavily calcified aortic annulus in our patient population negatively impacted the precision of LVOT diameter measurement by TTE. Moreover, other predictors of increased AS severity and/or worse prognosis, such as ELI and Zva were consistent with the reclassification on the basis of TEE measurements in our study. These parameters may be superior to Doppler AVA or gradient in predicting clinical outcomes due to assessment of the physiologic load imposed on the left ventricle.8)14) Ng et al.15) used multislice computed tomography (MSCT) as a gold standard to demonstrate that 3D planimetry of LVOT area by TEE was superior to 2D and 3D calculated LVOT area by TEE; however, they did not include TTE measurements.15) A recent large study compared hemodynamic and survival data in patients with severe AS undergoing 2D TTE and MSCT to measure AVA. The authors found that MSCT did not improve concordance of severity classification or better predict survival; however, TTE was not compared to TEE, and reclassification of categories of severe AS with respect to flow and gradient were not reported.16)
Our results suggested that the prevalence of PLFLG severe AS may be over reported due to underestimation of LVOT diameter and, in turn, AVA by TTE. Consequently, SVI may also be underestimated, falsely suggesting low flow. Importantly, BMI predicted discrepancy in LVOT diameter measurement between modalities. We also found that reclassified cases tended to have greater discordance among parameters of AS severity. Thus, these cases trended towards lower MG and peak velocity and higher DI. Similarly, physiologic parameters such as ELI and Zva were less supportive of severe AS in these cases. Erroneous classification of cases as PLFLG severe AS is clinically important, as it leads to additional downstream testing and/or procedural intervention with significant morbidity. Use of TEE or alternatively, CT, may be helpful in correctly classifying such cases. Dobutamine stress echocardiography may also be needed to differentiate between true stenosis and pseudostenosis.17)
Other potential sources of error such as small body size and misplacement of PW Doppler sample volume must also be considered.5) For cases reclassified on the basis of normal flow, underestimation of Doppler gradient across the aortic valve should be highly suspected. Prognosis for patients with PLFLG severe AS is reportedly similar to those with moderate AS.18)19) Therefore, prior studies of PLFLG severe AS may have included some patients misclassified as severe AS due to inaccurate LVOT measurement by TTE.
Strengths of this study included a larger sample size than previous studies that compared LVOT diameter by TEE and TTE. Few studies have made this comparison,10)13)20) particularly in the elderly population for which transthoracic measurement of the aortic annulus can be very challenging. LVOT measurements were performed by a single investigator (MMA) and were consistent both internally and externally. To our knowledge, this is the first report that reclassification of AS severity using LVOT diameter by 2D TEE may alter clinical management of patients otherwise classified as PLFLG severe AS by TTE measurements. We further demonstrated reclassification to moderate AS in other patient groups with severe AS; however, the incidence of reclassification was particularly high in the low flow and low flow, low gradient groups. This study highlights the need for further investigation of findings inconsistent with conventionally defined severe AS.
Limitations included a small sample size of patients with PLFLG with severe AS. However, reclassification was additionally reported in other patient subsets of the overall study population. This was a single center study, and the study population underwent both TTE and TEE within a short period. Therefore, the results may not be universally applicable. Non-echocardiographic measurements i.e., MSCT were not included in the present study and would strengthen the conclusion. TEE measurements are considered closest to a gold standard on the basis of superior spatial resolution and better correlation of TEE with MSCT and magnetic resonance imaging in prior studies.21)22) All measurements were taken in 2D. This does not fully eliminate the risk of misalignment and underestimation of the true cross-sectional area of LVOT. 3D echocardiography is limited by availability and expertise but may be superior to conventional (2D) techniques for AVA measurement.15)23) Future investigation with 3D echocardiographic and non-echocardiographic techniques is required.
 XML Download