

 PDF
PDF ePub
ePub Citation
 Print
Print


Introduction
Atrial fibrillation (AF) is the most common arrhythmia in clinical practice, and is associated with increased morbidity and mortality.1)2)3) Due to the fact that AF increases with advancing age, many studies suggest an increasing prevalence and incidence of AF, predicting that it will increase to 15.9 million by 2050, with more than half of all patients ≥80 years of age.4)5)6)7)8)9) Consequently, the economic burden associated with AF is increasing considerably, and is mainly driven by hospital visits, including hospitalizations and outpatient clinic visits.10) This public health burden is reported to be 1% of the National Health Service budget in the United Kingdom, estimated to be 16 to 26 billion dollars In United States.11)12)13) Therefore, the understanding of the trend in AF-related hospital cost is critical for healthcare planning and for reducing demands on the health insurance system.
South Korea is becoming an ageing society, and 7.2% of the total population was aged 65 years or older in 2000. Furthermore, the aging population is rapidly increasing, and it is expected that a quarter of the total population to be ≥65 years of age by 2030 (Statistics Korea. Korea statistical yearbook. http://kostat.go.kr/portal/english/index.action). However, there is paucity of data on AF incidence, prevalence, hospital cost and treatment patterns in South Korea, as well as other Asian countries. We sought to evaluate 1) the number of total and newly diagnosed AF individuals, 2) the burden of AF-related hospital visits and costs, 3) treatment patterns including medications and catheter ablation, and 4) morbidity and mortality, especially for cardiovascular disease and stroke related death using the South Korean National Health Insurance sample cohort population from 2004 to 2013.
Subjects and Methods
Data sources
National Health Insurance (NHI) is the single insurer managed by the Korean government; about 97% of the Korean population are mandatory subscribers and the remaining 3% of the population are medical Aid subjects. Based on this NHI database, the Korean National Health Insurance Dataset Sample Cohort (K-NHID-Sample Cohort) was created and released in 2014, and contains 1025340 individuals representing the total Korean population from its start in 2002, amounting to 2.2% of the entire population in the Korean National Health insurance Service, up until 2013. Because there were some dropouts due to death, some newborn cases were added each year to balance its dropouts and maintain consistent.
Study population
This observational cohort study using the NHID-cohort included a total of 819948 patients at ≥15 years of age from 2004-December 2013. Among this group, patients with AF were identified with Korean Classification of Disease 6th Revision (KCD-6) codes, which are codes from a validated modified classification system from the International Classification of Disease 10th Revision (ICD-10) codes, I48 (atrial fibrillation and atrial flutter), I48.0 (atrial fibrillation), and I48.1 (atrial flutter). We regarded the first date of receiving AF-related KCD-6 codes as a newly diagnosed year, and excluded the first 2 years (2002 to 2003) to avoid the possibility for misdiagnosis of preexisting AF for an incident of AF. Moreover, we defined patients with AF only when AF was a hospital discharge diagnosis or was confirmed on at least 2 visits in the outpatient clinic.14)15)
Patients' medical records and KCD-6 diagnosis codes were reviewed for information on age, gender, and comorbidities included in CHA2DS2-VASc (I50 for Congestive heart failure, I10, I11, I12, and I14 for hypertension, E10, E11, E12, E13, and E14 for Diabetes mellitus, I63, I64, and G45 for prior Stroke or transient ischemic attack, I21, I252, I65, I70, I71, I72, and I73 for Vascular disease) score.
Treatment patterns and outcome measurement
We included all AF patients ≥15 years of age and were followed for 10 years from 2004 to 2013. They were analyzed in terms of treatment patterns including medication for stroke prevention, rate control, rhythm control, and radiofrequency catheter ablation (RFCA). We only counted medications prescribed more than 3 months. Clinical outcomes assessed in this study included ischemic stroke-related admission, bleeding event-related admission including brain and gastrointestinal tract, all cause death, cardiovascular death, and stroke-related death for each case with the use of KCD-6 codes.
Statistical analysis
Descriptive statistics were used to characterize trends of AF-related hospitalization, out-patient clinic visits, hospital costs, incidence, prevalence, morbidity, mortality and treatment patterns. Pearson chi-square tests were used to describe the relationship between variables. Annual p for trend was determined by Wilcoxon-type test for trend across ordered groups. All tests were two-tailed, with p<0.05 considered significant. Statistical analysis was performed using The Statistical Package for the Social Sciences (SPSS 23.0; SPSS Inc., Chicago, IL, USA) and statistical software R package (R 3.2.3; R studio, Boston, MA, USA).
Results
Trend of hospitalizations and outpatient visit for AF
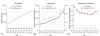
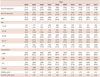
Table 1 shows the number of total patients with AF and the number of patients newly diagnosed with AF each year. In 2004, the number of patients with AF was 4197, and the estimated prevalence rate was 0.51%. In 2013, the prevalence rates progressively increased 2.69-fold between 2004 and 2013, and reached 1.38%.
In the period from 2004 to 2013, all comorbidities included in CHADS2 and CHA2DS2-VASc scores increased within one decade, thus the risk of stroke as determined by the mean CHADS2 score increased from 2.28 to 2.91, and the mean CHA2DS2-VASc score increased from 3.51 to 4.42 in the total AF population (p<0.001, Table 1).
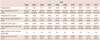
The number of hospitalizations per year increased 2.19-fold (1,120 to 2,451, p<0.001, Table 2, Fig. 1B), and the number of outpatient clinic visits had a 3.06-fold increase from 9847 in 2004 to 30150 in 2013 (p<0.001, Table 2, Fig. 1B). The number of mean hospital visits per patient/year showed no significant change for the decade (Fig. 1C).
Trends in hospital cost for AF
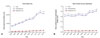
During the 10-year follow-up, total medical cost, which consisted of hospitalization costs and outpatient clinic visit costs progressively increased (p<0.001, Table 2, Fig. 2A). Hospitalization costs increased from 3.6 billion (won) in 2004 to 11.3 billion (won) in 2013 (p<0.001), and outpatient clinic visit costs increased from 0.3 billion (won) to 1.0 billion (won) in the same time frame (p<0.001. While the total medical cost increased for the decade, mean medical cost per patient/year also increased from 0.68 million (won) to 0.83 million (won) (p<0.001. This was mainly due to the increase of mean hospitalization costs per patient/year (Fig. 2B).
Stroke risk and management
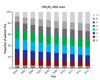
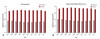
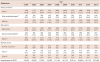
Patients' distribution according to CHA2DS2-VASc scores is presented in Fig. 3. The proportion of patients with CHA2DS2-VASc score ≥2 increased from 82.8% to 88.9% from 2004 to 2013. Although stroke risk for each patient increased annual according to the increase of CHADS2 and CHA2DS2-VASc scores, the proportion of patients with anticoagulation with warfarin showed no significant change from 2004 to 2013, and the proportion of patients who took aspirin showed no significant changes in the same time frame (Table 3, Fig. 4A). This trend was consistent among patients with CHA2DS2-VASc score ≥2 (Fig. 4B). The proportion of patients who took antiplatelet agents other than aspirin showed a modest increase in the same time frame (p<0.05 for trends, Table 3).
Rhythm and rate control of AF
Table 3 shows the trends of AF treatment with medication or RFCA. The use of beta-blockers (BB) showed a significant increase (22.6% to 27.1%, p<0.001 for trends), whereas calcium channel blocker (CCB) showed no significant changes during the decade. The use of digoxin significantly decreased from 23.4% in 2004 to 11.4% in 2013 (p<0.001).
The total use of anti-arrhythmic drugs (AADs), including Class Ic and Class III AADs showed a slight increase for the decade (6.8% to 7.6%, p<0.05 for trends), even though the use of class III drugs decreased (4.3% to 3.2%, p<0.05 for trends). The proportion of hospitalization for RFCA in the total number of hospitalizations showed an increase from 0.43 % in 2004 to 1.09 % in 2013 (p<0.001).
Morbidity and mortality of AF
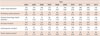
Ischemic stroke-related admissions and bleeding events related admissions, including GI bleeding and cerebral hemorrhage, showed no significant changes from 2004 to 2013 (Table 4). However, All-cause mortality (6.7% to 5.0%, p<0.001), cardiovascular mortality (1.4% to 1.1%, p<0.001) and stroke-related death (1.3% to 0.8%, p<0.001) showed a modest decrease from 2004 to 2013 (Table 4).
Discussion
The main finding of this study is that during the last decade, AF-related hospitalizations and outpatient clinic visits have increased with the increase of comorbidities. Second, although catheter ablation increased, the rate of anticoagulation did not improved. Although mortality in patients with AF showed a modest decrease from 2004 to 2013, proper anticoagulation therapy is warranted for the improvement of public health.
This investigation reports serial data of AF hospital visits over a 10-year period in South Korea with the use of 1 million population of Korean National Health Insurance Dataset Sample Cohort (NHID-Sample Cohort). Moreover, this is the first observational study to investigate hospital visits and hospital costs, treatment patterns, morbidity, and mortality of AF in this nation-wide semi-dynamic cohort.
Hospital cost
As expected, from 2004 to 2013, the number of patients with prevalent AF (3.64-fold) and the number of hospitalizations per year (2.19-fold) significantly increased. Consequently, the total hospital cost per year (256%) and mean medical cost per patient/year
(22%) showed a consistent increase for the 10-year follow-up. Consistent with our findings, many previous studies have shown that the number of AF-related hospitalizations, outpatient clinic visits and hospital costs increased with the aging population and more prevalent risk factors such as hypertension and diabetes.16)17) The aging population, with many other comorbidities, is rapidly increasing and it is expected that a quarter of the total population will be ≥65 years of age by 2030 in South Korea subsequently exponentially increasing AF-related medical costs. Moreover, the number of RFCA shows a consistent increase for the decade, which could contribute to the rise of hospital costs. Therefore, long-term healthcare planning for reducing demands on NHI is warranted for the next decade and beyond.
Trends in treatment patterns
Many studies have reported that the underuse of anticoagulation therapy increases with age,18)19) and a previous study reported that only 35% of patients aged >85 years of age receive anticoagulation.20) In this study, although the mean CHA2DS2-VASc score of the AF population increased from 3.5 to 4.4, the proportion of patients who received oral anticoagulation with warfarin did not show an increase, and even uses of aspirin did not show any changes for the decade. Moreover, this trend was also found in patients with CHA2DS2-VASc score ≥2, which indicates a high stroke risk and indication for anticoagulation. It is likely due to the deep concerns physicians have for the aging patient population. Since anticoagulation therapy for elderly AF patients could safely and efficiently be used compared to aspirin,21) education about anticoagulation at the national-level should be considered as a goal to improve awareness and public health. Moreover, a decrease in digoxin use for the decade could have an important clinical implication, because recent studies have shown adverse effects of digoxin as a rate-control drug and increased mortality of the AF population.15)22)
Mortality in AF
Previous studies have reported that global burden and AF associated mortality have increased exponentially.23)24) However, patients with AF in this national sample cohort population showed modest decrease of all-cause mortality, cardiovascular mortality and stroke-related death at the 10-year follow-up. Although it is unclear whether this result would be derived from proper rate control with the increase of beta blockers and decrease of digoxin use15)22) or if improvement in general medical care and the proportion of patients receiving anticoagulation therapy in patients with high stroke risk could further improve morbidity and mortality. Further analysis with the entire South Korean population is warranted for confirming these results.
Limitations
This study was a retrospective observational study that was performed as a nationwide sample cohort data. Because the study population is the semi-dynamic cohort with 10-year follow-up, comorbidities and demographic data of patients cannot accurately represent those of the general population as years go by. However, on the other hand, this cohort can show the effect of aging on a patient of AF after a 10-year follow-up. All patients with AF were identified according to their diagnosis, not electrocardiogram; patients with atrial flutter were also included in the AF population. However, the co-existence of AF in patients with atrial flutter has reported to have increased by 50% in previous studies, and international guidelines suggest that an atrial flutter should be anticoagulated with the same protocol as AF.1)25)26) Because recurrent events such as second or third stroke could not be assessed by the use of the diagnosis code, we used the number of strokes and bleeding related admissions instead of actual events. Therefore, an underestimated comparison to real-world incident event rates could have occurred and therefore may not represent real world event rates.
In conclusion, during the last decade, hospital visits and costs for AF have increased exponentially among South Korea adults, and the proportions of comorbid chronic diseases and patients ≥75 years of age have also increased significantly in the AF population. The trend of treatment patterns have shown significant changes, especially in the increase of beta blocker use, anti-arrhythmic drug use and RFCA, and decrease of digoxin use whereas the proportion of patients who received proper anticoagulation therapy showed no increase. Although all-cause mortality, cardiovascular mortality, and stroke-related mortality in patients with AF showed a modest decrease for the last decade, and the long-term plan at the NHI level for reducing AF-related medical cost, such as national-level education for proper anticoagulation therapy, are warranted for the improvement of public health.
 XML Download