

 PDF
PDF ePub
ePub Citation
 Print
Print


Introduction
Hypertension is a major independent risk factor for atherosclerotic vascular diseases such as coronary arterial disease (CAD) in the worldwide population.1) According to the traditional definition of hypertension as systolic blood pressure (SBP) ≥140 mmHg or diastolic blood pressure (DBP) ≥90 mmHg, about one-fourth of the adult population in Korea has hypertension, as do about 50% of patients with acute myocardial infarction (MI).2) It has long been known that a higher SBP causes higher mortality in CAD and stroke,3) and that lowering the blood pressure (BP) rapidly reduces cardiovascular risk.4)
In terms of treatment, decreasing a high BP into the normal range decreases the risk of cardiovascular disease5) and stroke;6) however, there is still strong debate about the optimal BP target. While a lower DBP can reduce cardiac workload, it can also impair coronary perfusion. Therefore, the ‘J curve phenomenon’ has been suggested7) and warns against excessive BP lowering. The concept has been challenged because of several confounding factors like age and past medical history.
Subjects and Methods
The target population was selected from the Korea Acute Myocardial Infarction Registry (KAMIR). KAMIR is a Korean prospective, multi-centered data collection registry reflecting real-world treatment practices and outcomes in Asian patients diagnosed with acute MI. The registry consists of 50 community and teaching hospitals with facilities for primary percutaneous coronary intervention (PCI) and on-site cardiac surgery. Data were collected by trained study coordinators using a standardized case report form and protocol. The study protocol was approved by the ethics committee at each participating institution.
A total of 13627 patients from KAMIR who were registered from November 2011 to July 2014 were selected. Among them, 10337 patients who underwent PCI and survived acute MI without complications were finally included. Patients who met the following criteria were excluded from the study: no significant fixed coronary arterial stenosis (vasospastic MI), no PCI, no elevation of cardiac enzymes, significant underlying disease such as malignancy, advanced liver disease, active infection, or inability to take medications.
A diagnosis of acute MI was made by clinicians based on the 2012 European Society of Cardiology/American College of Cardiology Foundation/American Heart Association/World Heart Federation (ESC/ACCF/AHA/WHF) diagnostic criteria.10) The following baseline data were collected before coronary angiography (CAG): age, gender, history of CAD risk factors, baseline two-dimensional echocardiographic data, baseline laboratory data, and vital signs. Data collection was mainly based on the clinician's records and in-hospital examination results. CAG was performed via a transradial or transfemoral approach after administration of heparin. All patients received proper medical treatment including dual antiplatelet agents before and after CAG, in accordance with current guidelines. Coronary artery stenting was performed using a standard technique. Operators of each PCI made the decision to perform pre-dilation, direct stenting, and post-adjunctive balloon inflation, according to each patient's circumstances. BP was measured at the time of presentation in the supine position and at the left or right brachial artery by an attending nurse using a manual sphygmomanometer. BPs were measured throughout hospitalization in the same way.
Clinical follow up data were collected at 6, 12, and 24 months after discharge. At each clinical follow up, vital signs were measured, and the occurrence of major adverse cardiac event (MACE) was investigated. If there was any MACE requiring hospitalization, the BP measured at the time of hospitalization was used for analysis. If no MACE occurred, BP was measured in an outpatient clinic after at least five minutes of rest, in a seated position. After data collection, the entire target population was divided into quintiles according to average BP (SBP and DBP) during the follow up period, and the incidence of MACE was compared between quintiles.
Statistical Package for Social Sciences (SPSS) 22.0 for Microsoft Windows (SPSS Inc., Chicago, IL, USA) was used for all statistical analyses. All numerical variables are presented as mean±standard deviation and were compared by independent samples t-test. All categorical variables are shown as number and percentage and were compared using Chi-square or Fisher's exact test to determine the significance of differences. Cox regression analysis was used to determine independent risk factors for occurrence of MACE. All statistical tests were two-tailed, and a p value<0.05 was considered statistically significant.
Results
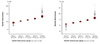
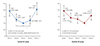
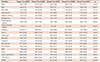
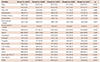
The average BP during the two-year clinical follow up of the entire population was 112.7±15.1 mmHg for SBP and 68.0±10.3 mmHg for DBP. BP distribution and the average BP of each group are displayed in Fig. 1. The lowest quintile had an average SBP of 93.6±5.0 mmHg (group 1), while the higher quintiles had average SBPs of 103.6±2.1 mmHg (group 2), 111.2±2.4 mmHg (group 3), 119.8±3.0 mmHg (group 4), and 135.2±9.1 mmHg (group 5). The lowest quintile had an average DBP of 54.6±3.9 mmHg (group 1), while the higher quintiles had average DBPs of 61.8±1.7 mmHg (group 2), 67.1±1.7 mmHg (group 3), 73.3±1.9 mmHg (group 4), and 83.2±5.6 mmHg (group 5). Each group’s baseline characteristics are listed in Table 1 according to SBP and in Table 2 based on DBP. Most patients were male (75.8%), and the mean age of the study population was 63.2±12.9 years. Although a statistically significant difference was identified in mean age across the groups, only a small difference existed in the actual values.
About half of the entire population had a previous history of hypertension (49.5%), and 14.2% of patients were already diagnosed with CAD before index hospitalization. Higher quintile groups tended to have a higher prevalence of risk factors for atherosclerosis, such as hypertension and diabetes mellitus.
PCI was successful in the vast majority of patients (97.1%, defined as post-PCI thrombolysis in myocardial infarction [TIMI] flow III). The use of beta-adrenergic receptor blockers was lower in the lowest quintile, and angiotensin-converting enzyme inhibitors (ACEi) or angiotensin receptor blockers (ARB) were used more frequently in higher quintiles. Only a few patients received both ACEi and ARB simultaneously.
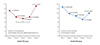
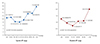
During the two-year clinical follow up, 9.7% (n=1005) of patients experienced at least one MACE. Cardiac death occurred in 2.6% (n=265) of all patients, and 4.8% (n=497) required repeat revascularization due to recurrent anginal symptoms or recurrence of MI. In addition, 0.7% (n=76) of the patients experienced cerebrovascular accident (CVA), and hospitalization was required in 2.7% (n=274) due to heart failure. The cumulative incidence of MACE was assessed against both SBP and DBP, revealing a U-shaped relation between the two variables (Fig. 2). MACE occurred most infrequently in SBP group 3 (MACE in 159 of 2067 [7.7%] patients), with a similar MACE rate in group 2 (average SBP 103.6±2.1 mmHg) and group 4 (average SBP 119.8±3.0 mmHg). Among the DBP groups, the MACE rate was the lowest in group 4 (average DBP 73.3±1.9 mmHg, MACE in 151 of 2068 [7.3%] patients).
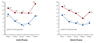
The study groups were divided into two subgroups: patients with prior history of hypertension and those without. MACE rates were then compared between these groups. In patients without prior history of hypertension, the average SBP was 93.1±4.8 mmHg (group 1), 103.2±2.3 mmHg (group 2), 112.1±2.1 mmHg (group 3), 117.7±3.2 mmHg (group 4), and 134.2±8.3 mmHg (group 5). The average DBP in those without a history of hypertension was 54.7±3.7 mmHg (group 1), 62.0±1.7 mmHg (group 2), 66.7±2.0 mmHg (group 3), 73.7±1.8 mmHg (group 4), and 82.8±5.3 mmHg (group 5). In patients with prior history of hypertension, average SBP was 93.7±5.0 mmHg (group 1), 103.6±2.1 mmHg (group 2), 111.3±2.4 mmHg (group 3), 119.9±3.0 mmHg (group 4), and 135.7±9.5 mmHg (group 5). The average DBP for those with preexisting hypertension was 54.5±4.2 mmHg (group 1), 61.7±1.7 mmHg (group 2), 67.1±1.6 mmHg (group 3), 73.3±2.0 mmHg (group 4), and 83.5±5.7 mmHg (group 5). The U-shaped relation was still observed in this subgroup analysis; however, despite similar BP control rates between patients with or without history of hypertension, MACE rate was considerably higher in patients with history of hypertension (Fig. 3).
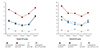
A similar trend was observed in occurrence rate of each component of MACE, except CVA, which occurred very infrequently (<1% in most groups) (Fig. 4). The U-shaped relation to MACE was statistically significant in Cox regression analysis for both SBP and DBP, except between SBP groups 2, 3, and 4 (Fig. 5).
In Cox regression analysis, higher age, higher Killip class (III or IV) at presentation, previous history of hypertension, and diabetes were also shown to be independent risk factors for MACE occurrence. On the contrary, use of prasugrel, ticagrelor, beta-blockers, or statins was shown to be protective against MACE (data not shown).
Additionally, total MACE rates were analyzed after patients were grouped according to SBP and DBP ranges (divided by 10 mmHg ranges). In general, plotting MACE rates against BP ranges showed a U-shaped relation (Fig. 6), just as when the patients were divided into quintiles. The BP ranges with the lowest MACE rates were 110–119 mmHg for SBP and 70–79 mmHg for DBP. While the U-shaped relation showed a broad base with similar MACE rates for SBPs between 100 and 129 mmHg, the curve had a sharp base with a remarkably lower MACE rate for DBPs of 70–79 mmHg.
Discussion
The results of this study suggest that excessive lowering of BP during clinical follow up in patients with acute MI can lead to a worse outcome. Although hypertension is an independent predictor of death and MI11) and is a predictor of in-hospital mortality in patients with acute MI,12) specific BP targets have not been set in patients with acute coronary syndrome since specific BP lowering trials have not been performed.
Although lowering the BP can decrease cardiac workload and improve cardiac function by reducing cardiac afterload, there is concern that excessive BP lowering can impair coronary perfusion. This can be especially important in patients with acute MI, as they have reduced coronary flow reserve compared to the general healthy population.13) Even after a successful revascularization procedure, hearts of patients with acute MI can still have residual ischemic burden due to several causes, such as untreated segments of target or non-target vessels or ischemia from microvascular causes even in the absence significant residual coronary arterial stenosis. In such circumstances, BP that is too low (especially DBP) can cause ischemic symptoms and necessitate additional revascularization procedures during clinical follow up, as reflected in our results.
We still do not know if a lower BP threshold will cause harm to coronary blood flow in humans.1) Despite some animal experiments conducted on lower BP threshold, clinical trials and observational studies should be the primary sources of information to define this threshold. An analysis of the International Verapamil SR-Trandolapril Study (INVEST) suggested that the relation between MACE rate and SBP was J-shaped, with the SBP/DBP nadir at approximately 125–145/55–80 mmHg in hypertensive patients with previous (≥1 month) history of coronary revascularization (coronary arterial bypass graft, PCI, or both).14) Additionally, in other trials, such as the Secondary Manifestations of Arterial Disease (SMART) study, similar J-shaped curves between BP and cardiovascular events were observed, with a BP nadir of 143/82 mmHg in patients with various manifestations of vascular disease.15) However, in the Comparison of Amlodipine vs. Enalapril to Limit Occurrences of Thrombosis (CAMELOT) study, patients with CAD did not exhibit a J-shaped curve.16) In the recent Systolic Blood Pressure Intervention Trial (SPRINT), targeting a SBP less than 120 mmHg, as opposed to the typical target of less than 140 mmHg, resulted in lower rates of fatal and nonfatal major cardiovascular events from any cause in patients with SBP >130 mmHg and increased cardiovascular risk from proven cardiovascular disease, chronic kidney disease, old age, etc.17) Therefore, insufficient evidence has confirmed the concept of the J-shaped curve.
In our study, we present evidence for the existence of the ‘U-shaped curve phenomenon,’ which is similar to the J-shaped curve with respect to both SBP and DBP for secondary prevention of adverse events after acute MI. Although this conclusion is limited by the study’s observational nature, certain methodological errors and several confounding factors, such as patient age, different prevalence of cardiovascular risk factors, and underlying comorbidities, it is noteworthy that ‘excessively low’ BP, with a nadir at 111.2/73.3 mmHg (group 3 for SBP, group 4 for DBP), was shown to be an independent risk factor of MACE in patients with acute MI after successful PCI. This does not imply that high BP in patients with acute MI should not be controlled. Just as the SPRINT demonstrated, our results showed that patients with an average SBP of 100–119 mmHg had a notably lower MACE rate than those with average SBP of 130–139 mmHg. Also, patients with prior history of hypertension had significantly higher MACE rate than those without, despite similar BP control, which emphasizes the importance of hypertension in the prognosis of CAD. Multiple mechanisms, such as upregulation of the sympatho-renin-angiotensin-aldosterone system, downregulation of vasodilators, and increased expression of inflammatory cytokines, contribute to BP elevation and related target-organ damage.1) Therefore, high BP should be lowered to a range that causes no significant harm from hypotension.
In this study, patients in lower BP quintiles (groups 1 and 2) tended to have lower prevalence of atherosclerotic risk factors, such as hypertension or diabetes mellitus, which were proven to be independent risk factors of MACE. Blood vessels stiffen due to advanced atherosclerosis, DBP decreases, and pulse pressure usually increases.18) Since patients in lower quintiles had relatively lower prevalence of atherosclerotic risk factors, we cannot consider lower DBP to be a consequence of advanced atherosclerosis, which has been thought to be an important confounding factor for the concept of the J-shaped curve. Inversely, higher MACE rates despite fewer risk factors in lower quintiles suggest adverse effects of excessively low BP, or the U-shaped curve phenomenon, independent of the effects of other risk factors.
One distinctive feature of this study is that we targeted patients with acute MI starting at the time of diagnosis. In many of the large studies described above,14)15)16) the severity, type, and time of diagnosis of atherosclerotic vascular disease were not uniform. However, in this study, all of the enrolled patients had been diagnosed with acute MI that required PCI. This means that the enrolled patients can be considered to have the lowest coronary flow reserve, indicating the stronger need for adequate BP control compared to other populations, like those with a history of hypertension only or those without proven atherosclerotic coronary arterial disease. Although ischemic burden cannot be completely identical among people in a population, patients in this study all had at least one significantly narrowed or totally occluded coronary artery that caused myocardial necrosis. Therefore, the degree of BP control could have affected the coronary arterial system to a relatively similar degree across the population.
This study has some limitations. First, this is an observational study from KAMIR; therefore, despite the use of statistical methods to minimize confounding effects from several factors, such effects on our results cannot be completely eliminated. Second, we could not access the efficacy of each antihypertensive agent on clinical outcomes, given that the type and dose of antihypertensive medications varied among patients. Third, since we could not access the entire population's baseline and follow up echocardiographic data, a possible relation between low BP and low cardiac function could not be analyzed. Lastly, although a standard technique for BP measurement was used, there is potential for inconsistency between participating medical centers; thus, a small measurement bias could exist.
In conclusion, despite the several limitations described above, the results of this study showed a ‘U-shaped curve phenomenon’ between MACE rate and both SBP and DBP during clinical follow up in patients with acute MI. BP less than 112.2/73.3 mmHg seemed to be associated with worse clinical outcome; however, this phenomenon remains to be verified by larger, randomized clinical trials.
 XML Download