

 PDF
PDF ePub
ePub Citation
 Print
Print


Introduction
Functional quantification by using strain and strain rate through speckle tracking echocardiography has been developed as a promising tool in recent clinical situations.1)2)3) The recent introduction of two-dimensional (2D) strain and strain rate imaging by using the speckle tracking method for an accurate assessment of global and regional myocardial function has been studied for use in a variety of clinical settings.4)5)6)7)8) However, the use of these tools in right ventricle (RV) failure and the manner in which they both reflect the functional capacity of patients have not yet been studied thoroughly, although the importance of RV in the management and prognosis of many cardiac diseases–such as congestive heart failure, arrhythmia, and sudden cardiac death-is increasingly being recognized.9)10) In the present study, we assess the changes in RV function due to continuous RV volume overload in patients with atrial septal defects (ASDs) on the basis of strain and strain rate. Likewise, we analyze the correlation between the changes in strain and strain rate in patients at 1 month after transcatheter closure of ASD in the process of recovery from right heart failure and the changes in exercise capacity as measured with the cardiopulmonary exercise test (CPET). By doing so, we expect to gather objective information about both the role of strain and strain rate in the assessment of RV function, and the changes in exercise capacity due to the changes in strain and strain rate in the process of RV reverse modeling.11)12)13) Therefore, the aim of our study was to investigate the change in exercise capacity and strain pattern before transcatheter closure of ASD and at 1 month after the procedure.
Subjects and Methods
Patients
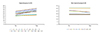
A total of 30 patients who underwent transcatheter closure of ASD between May 2014 and June 2015 at our institution were enrolled. All patients consented to an agreement approved by the institutional review board of the Human Research Protection Center of the Severance Hospital Yonsei University Health System (IRB no. 2013-0104-001). Twenty-one patients were included in the ‘improved’ group, which was defined as patients with improved exercise capacity before and after the procedure; and nine patients were included in the ‘non-improved’ group, which was defined as patients with decreased or unchanged exercise capacity before and after the procedure (Fig. 1). We excluded all patients who concurrently had pulmonary hypertension at the time of diagnosis (which was defined as a mean pulmonary arterial pressure of ≥25 mmHg on cardiac catheterization), as well as those who did not want to continue with the study after 1 month.
Transthoracic echocardiography
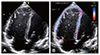
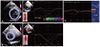
All examinations were performed with subjects in the supine position, using a GE E9 machine (Vivid 9; GE Medical Systems, Milwaukee, WI, USA). T=To minimize inter-observer and intra-observer variations, one well-trained person performed all examinations. Strain and torsion were calculated from the obtained 2D echocardiographic data by using the EchoPAC system software (GE Medical Systems, Milwaukee, WI, USA). The global RV longitudinal (GRVL) strain, obtained through a full RV myocardium method, was calculated on the basis of the entire trace contour of the RV via apical four-chamber view 2D echocardiography (Fig. 2). Moreover, LV torsion was determined from the parasternal short-axis view of the 2D echocardiogram at the mitral valve (basal) and apical levels (Fig. 3). To minimize inter-observer and intra-observer variations, semi-automatic endocardial border tissue tracing was performed at an average of three times per study.
Cardiopulmonary exercise test
All patients carried out a maximal, symptom-limited (fatigue or dyspnea) CPET by using the Bruce ramp protocol.16) Patients were encouraged to continue with the exercise for as long as they could. The maximal oxygen consumption (VO2max), carbon dioxide production (VCO2), minute ventilation (VE), work load, lactate threshold (LT), and age-predicted exercise capacity (APEC) were measured by using breath-by-breath gas analysis. A standard 12-lead electrocardiogram was continuously recorded. Blood pressure was measured with a cuff sphygmomanometer. VO2max was defined as the amount of oxygen consumed by the body at the peak of tolerable exercise. VE/VCO2 was defined as ventilator efficiency. The LT was defined as the point at which oxygen delivery to the muscles failed to meet 100% of demand, requiring anaerobic metabolism to supplement the energy requirements. The initial phase of CPET lasts until 50-60% of VO2max is reached. VE increases linearly with VO2 and reflects aerobically produced CO2 in muscles. The blood lactate levels do not change during this phase. During the latter half of the exercise, anaerobic metabolism occurs because the oxygen supply cannot meet the increasing metabolic demands of the exercising muscles. At this time, there is a significant increase in lactate production in the muscle and in blood lactate concentration. The VO2 at the onset of blood lactate accumulation is called the LT. All patients underwent CPET before the procedure and at 1 month after the procedure, each according to protocol.
Statistical analysis
Statistical analysis was performed by using SAS (version 9.3; SAS Inc., Cary, NC, USA). Continuous values are reported as mean±standard deviation. The Shapiro-Wilk test was used to check for normality of distribution. If the data followed a normal distribution, a paired t-test was used to compare the differences in parameters before the closure and 1 month after the procedure, and the independent t-test was used to compare the differences between the improved and non-improved groups. If the data did not follow a normal distribution, the Wilcoxon signed-rank test was used to compare the differences in parameters before the closure and 1 month after the procedure, and the Mann-Whitney U-test was used to compare the differences between the improved and non-improved groups. The comparisons of differences between before and after the procedure in each group were analyzed by using a linear mixed model. A p value was obtained from Fisher's exact test. Differences were considered to be statistically significant when the p value was <0.05.
Results
Baseline patient characteristics
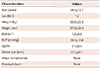
Transcatheter ASD closure with the Amplatzer septal occluder (AGA Medical Corporation, Golden Valley, MN, USA) device was successfully performed for all patients. The patient characteristics are presented in Table 1. Their mean age was 34.5±12.1 years (range, 15-55 years), and the male-to-female ratio was 1:2. The peak RV pressure (pRVP) was 36.6±10.8 mmHg, and the mean ratio of pulmonary to systemic blood flow (Qp/Qs) was 2.1±0.5. The mean size of the implanted device was 22.3±4.9 mm. There was no mortality; and there were no major complications such as device embolization, cardiac tamponade, life-threatening arrhythmias, or vascular complications requiring surgery. After 1 month of follow-up, there was no residual shunt.
Parameters before and after the procedure
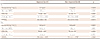
All patient results before and after ASD closure are provided in Table 2. In CPET, the VO2 max (27.0±4.5 to 31.3±6.9 mL·kg-1·min-1, p<0.0001), metabolic equivalents (METs) (7.7±1.2 to 8.7±1.8 METs, p<0.0001), and APEC (72.0±20.6% to 78.7±20.1%, p=0.0013) were significantly improved after ASD closure. NT-proBNP (87.9±55.9 to 118.3±91.3 pg/mL, p=0.0071) and MPV (8.0±0.7 to 9.0±1.4 fL, p=0.0067) were both significantly increased after ASD closure. In the strain parameters, LV torsion was increased significantly (10.4±2.3°/ms to 12.7±3.0°/ms, p=0.001). GRVL strain was decreased; however, the difference was not statistically significant (p=0.0528). The VE/VCO2 slope was not significantly changed.
Comparison between the improved and non-improved groups in CPET
To find the correlation between CPET results and strain, the patients were divided into an ‘improved’ group (n=21) with increased exercise capacity (VO2 max) and a ‘non-improved’ group (n=9) with unchanged or decreased exercise capacity (VO2 max). Fig. 1 shows the changes in individual exercise capacity within each group. The sex composition and age, Qp/Qs, and RV pressure (RVP) were similar between the two groups. However, the device size was significantly greater in the improved group (23.7±4.8 vs. 19.0±3.5 mm, p=0.014) (Table 3). In the comparison of differences in CPET between the two groups before the closure and 1 month after the procedure, APEC was significantly higher in the improved group (78.2±20.5% vs. 57.7±12.6%, p=0.0099) before the procedure, and the other parameters except for VE/VCO2 were increased significantly in the improved group after the procedure (Table 4).
Comparison of NT-proBNP and MPV between the improved and non-improved groups before and after the procedure
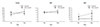
NT-proBNP was significantly higher in the non-improved group than in the improved group before closure (35-100 vs. 82-211 pg/mL, p=0.0087) and at 1 month after the procedure (31-85 vs. 131-305 pg/mL, p=0.0004) (Table 5), (Fig. 4). In the comparison of each group before the closure and 1 month after the procedure, NT-proBNP was only increased significantly post-procedure in the non-improved group (p<0.0001) (Table 5). MPV showed no difference between the two groups (p=0.1457) before the procedure, but it was significantly larger in the improved group (8.1–10.3 vs. 7.1–9.6 fL, p=0.0174) at 1 month after the procedure (Table 6). In the comparison of each group between before the closure and 1 month after the procedure, MPV was significantly larger post-procedure than pre-procedure in the improved group (p=0.0001), and was not significantly different at pre-procedure and post-procedure in the non-improved group (p=0.4837) (Table 6).
Comparison of the strain pattern between the improved and non-improved groups before and after the procedure
LV torsion was significantly higher in the non-improved group (12.2±1.9°/ms vs. 9.7±2.1°/ms, p=0.0046) (Table 7). LV torsion was significantly increased post-procedure (13.5±3.0°/ms vs. 9.7±2.1°/ms, p<0.0001) in the improved group, but was decreased post-procedure (10.8±2.3°/ms vs. 12.2±1.9°/ms) in the non-improved group, with no statistical significance (p=0.0911) (Table 7), (Fig. 4). Although there was no significant difference in GRVL strain between the improved and non-improved groups at pre-procedure and post-procedure (p=0.1295, p=0.1132), a tendency toward a decrease post-procedure (−18.1 [−20.8 to −15.8]%/ms) as compared with pre-procedure (−21.6 [−24.2 to -20.3]%/ms) was observed in the improved group, as well as an increase post-procedure (−27.2 [−28.0 to −16.4]%/ms) as compared with pre-procedure (−17.5 [−23.8 to −17.3]%/ms) in the non-improved group (Table 7).
Discussion
For decades, echocardiographic methods have been developed to accurately evaluate heart function in various cardiovascular diseases. Conventional echocardiography, which is focused on the subjective functional assessment of ventricles through “eyeballing” 2D clips, is still the most frequently used technique in routine clinical settings.17) Although conventional echocardiography is considered to be reliable for the assessment of heart function, the visual assessment of wall motion and thickening for the estimation of heart function is very subjective and is highly dependent on the operator. It is also subject to inter-observer and intra-observer variabilities, and allows for only a limited assessment of radial displacement and deformation, without the possibility of evaluating myocardial shortening and twisting. These limitations may be overcome through the measurement of regional myocardial deformation parameters with strain and strain rate. Few clinical studies have demonstrated the usefulness of the evaluation of myocardial function by using strain and strain rate in children and adults; however, the obtained information remains insufficient.18) According to a few studies, GRVL strain seemed to be a sensible and stable indicator of RV function (dependent on loading conditions). Therefore, our study aimed to prove the usefulness of the assessment of RV function by using strain and its correlation with exercise capacity and echocardiographic parameters.
Although the size of the defect in the improved group was large, the pre-procedure NT-proBNP and MPV levels were lower than in the non-improved group, and only APEC was high in the CPET. Moreover, the lower LV torsion and higher GRVL strain in the non-improved group pre-procedure was believed to be due to the difference in the right-side volume overload caused by the left to right shunt, affected by the difference in defect sizes. Although our study excluded patients with pulmonary hypertension, Nagaya et al.19)20) reported that the existence of pulmonary hypertension in patients with increased NT-proBNP was important, and that the NT-proBNP level was higher with pressure overload than with volume overload. Kaya et al.14) reported that MPV, an indicator of platelet activation, was significantly higher and correlated with pulmonary hypertension in patients with ASD, and may also be used as an adjunctive diagnostic tool in diagnostic pulmonary hypertension. The change of MPV was not significantly correlated with the results of both groups because our study (as mentioned above) excluded patients with pulmonary hypertension. Likely, the change of MPV with each group from before to after the procedure was considered to be the result of hemodynamic changes due to the rapidly-decreased RV volume/mass ratio after the procedure. On the basis of the normalization of the RV volume after ASD device closure, it may be considered that the decreased range of RV motion resulted in decreased GRVL strain.
Furthermore, Gorcsan and Suffoletto8) explained the decreased exercise capacity shown in CPET in ASD patients. In this study, although there was no difference in RVP or Qp/Qs between the two groups, the changes in the NT-proBNP level between pre-procedure and post-procedure were more apparent in the non-improved group than in the improved group, In addition, considering the difference in APEC as shown in CPET before the procedure-and considering the fact that the VE/VCO2 slope was more shallow in the improved group than in the non-improved group both before and after the procedure (although not statically significant, as the pRVP in the two groups were in the reference range)-the possible risks of pulmonary hypertension had caused the change in the level of exercise capacity.
Along with the change in the NT-proBNP level after the procedure, LV torsion was decreased in the non-improved group, whereas it was increased in the improved group. As a result, the levels were lower in the improved group than in the non-improved group. This result significantly correlates with the change in the NT-proBNP level and the improvement of exercise capacity in patients with ASD device closure in our study. According to Dong et al.,21) and Wu et al.,22) early LV dysfunction occurred after defect closure and the shutdown of the left-right (L-R) shunt, which was shown to be more significant in the non-improved group. According to Giardini et al.,23) this implied that before defect closure, a high volume overload was applied to the RV owing to the difference in the L-R shunt amount, which was affected by the difference in the defect size. Moreover, after the procedure and closure of the shunt, the preload applied by the volume overload was removed; however, the increase in left atrial pressure due to the increase in pulmonary vein pressure, and thus the increase in pulmonary artery pressure, increased the RV afterload in sequence, leading to the consequence. After the procedure and the shutdown of the L-R shunt, the under-loaded LV underwent reverse remodeling owing to increased LV volume and cardiac output. The GRVL strain was decreased in all patients after the procedure in our study. It was definitely decreased in the improved group as compared with the non-improved group after the procedure. This decrease was believed to be a process of reverse remodeling of the RV while reducing the RV volume overload after the procedure. On the other hand, the GRVL strain of the non-improved group was significantly increased after the procedure, showing that the reverse remodeling of the RV was insufficient after the procedure. Therefore, the increased GRVL strain was highly correlated with the decreased or unchanged exercise capacity in the non-improved group. NT-proBNP was significantly higher in dilated cardiomyopathy or heart failure, and it correlated with LV stretch.24) Our study showed that NT-proBNP was significantly increased according to the normalized under-loaded LV after the procedure. Accordingly, the increase in LV torsion was strongly correlated with increasing exercise capacity. Therefore, the increased exercise capacity after ASD device closure strongly correlated with the change in GRVL strain, LV torsion, and NT-proBNP.
This study has some limitations. The overall patient number was small, and the follow-up period was short. However, its strength lies in showing that RV remodeling and the differences in several parameters before and after transcatheter closure of ASD was the main cause of the short-term difference in exercise capacity after the procedure. Furthermore, along with additional data collection-and the use of pulmonary vascular resistance or CPET data other than RVP, NT-proBNP, MPV, LV torsion, and GRVL strain-a scoring system should be invented to estimate the prognosis of the exercise capacity or the level of heart failure in patients after the closure of a large ASD.
Conclusion
This study showed that patients recovered their exercise capacity after the transcatheter closure of ASD. The recovery of exercise capacity showed that this correlated with the degree of decreased GRVL strain and the degree of increased NT-proBNP and LV torsion before and after the procedure. Through this correlation, the above-mentioned parameters are expected to be useful prognostic factors for recovery of exercise capacity in patients with ASD device closure. Larger studies are needed to prove the reproducibility of strain and the feasibility of its use as a practical tool for the assessment of RV function in routine clinical settings.


 XML Download