

 PDF
PDF ePub
ePub Citation
 Print
Print


Introduction
Eosinophilic myocarditis, a disease characterized by eosinophilic infiltration of the myocardium, is known to have several key imaging features on cardiac magnetic resonance (CMR) imaging–high signal intensities on T2-weighted images (T2WI) and subendocardial enhancement on late Gadolinium enhancement (LGE) images. Over the past few years, T1 mapping has come to be used in various diseases of the heart as a method of tissue characterization. However, to our knowledge, there have not been any reports of T1 mapping of eosinophilic myocarditis. Recently, we have experienced a case of eosinophilic myocarditis in which T1 mapping was as illustrative as the conventional LGE images and would like to report the findings. This case report was approved by the Institutional Review Board of our institution.
Case
A 75-year-old female with a history of asthma and hypertension had complained of dyspnea and chest discomfort, and was referred to our hospital for further evaluation. Her laboratory findings showed positive for troponin-T and elevated levels of creatine kinase-MB (24 U/L), troponin-I (0.84 ng/mL), and pro-brain natriuretic peptide (15745 pg/mL); her chest PA did not reveal any abnormality. Electrocardiogram showed ST depression on lead I, aVL, and V4-V6 leads, as well as ST elevation on V1-V2 leads. With the impression of a myocardial infarction on the anterior, septal, and lateral walls, a coronary angiography was performed only to reveal normal coronary arteries.
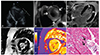
She subsequently underwent transthoracic echocardiography, which demonstrated apical hypertrophy with impaired left ventricular relaxation (Fig. 1A). For further evaluation, a CMR was performed on a 3.0-T scanner (Siemens Verio, Erlangen, Germany). A thickened apical wall was noted on cine images, similar to findings on the echocardiography. T2WI (Fig. 1B) demonstrated multifocal, patchy high signal intensity lesions throughout the left ventricular wall, suggesting areas of edema. LGE images (Fig. 1C, D) showed diffuse subendocardial enhancement in the left ventricular wall with non-enhancing lesions in the apex, which was presumed to be a mural thrombi.
Quantitative T2 mapping with a T2-prepared SSFP pulse sequence and pre-T1 mapping with a Shortened modified Look-Locker inversion recovery (shMOLLI) technique were performed during the mid-diastolic phase along the same short-axis planes as the T2WI. The acquisition parameters for T2 mapping were: field-of-view 276x340 mm, slice thickness 6 mm, TR 243.9 ms, TE 1.3 ms, matrix 192x124 pixels, TI=100 ms, flip angle=50°. The acquisition parameters for T1 mapping were: field-of-view 273x340 mm, slice thickness 8 mm, TR 567.0 ms, TE 1.1 ms, matrix 192x124 pixels, TI=100 ms. Post-T1 mapping was performed 15 minutes after the contrast media injection, using the same slice axis and parameters as pre-T1 mapping. T2-pixel maps and pre-post T1-pixel maps were generated using commercially available software on the scanner's workstation (Syngo; Siemens Medical Solutions, Erlangen, Germany).
On quantitative T2 map images, myocardial T2 values increased to about 45.1±1.4 milliseconds (ms) (reference value at our hospital: 40.5±2.6). The precontrast T1 value of the myocardium slightly increased to 1306.0±19.2 ms (reference value at our hospital: 1278±30). Interestingly, the apex (Fig. 1E) showed oval areas with a decreased T1 value (1007±84.67 ms), which corresponded to the mural thrombi seen on the LGE images. The T1 value of the subendocardium immediately adjacent to the mural thrombi was diffusely increased (1527±67.41 ms), corresponding to areas that showed subendocardial enhancement on the LGE images. The myocardial extracellular volume (ECV) fraction of the enhancing area was calculated according to the reference1) with post-contrast T1 mapping and hematocrit, and greatly increased to 40.4±4.5% (reference value at our hospital: 27.4±2.4%). All these CMR findings suggested a diagnosis of eosinophilic myocarditis in the thrombotic stage. The patient underwent an endomyocardial biopsy, which revealed an eosinophilic infiltration in the myocardial interstitium (Fig. 1F).
With the patient's history of asthma, peripheral eosinophilia (white blood cell count 13700/uL with 37% eosinophils), as well as sinusitis, Churg-Strauss syndrome (CSS) was suspected. She also tested positive for cytoplasmic antineutrophil cytoplasmic antibodies (C-ANCA) and an anti-myeloperoxidase antibody, but was negative for perinuclear cytoplasmic antibodies (p-ANCA). She satisfied four out of the six American College of Rheumatology diagnostic criteria for CSS- 1) asthma, 2) peripheral eosinophilia, 3) paranasal sinus abnormality 4) extravascular eosinophil infiltration on biopsy2) - and her eosinophilic myocarditis was thought to be a cardiac manifestation of CSS. She was treated with corticosteroid therapy, but her condition deteriorated and she expired after three weeks.
Discussion
Eosinophilic myocarditis is known to be caused by a systemic disease such as CSS or hypereosinophilic syndrome, a parasite infection, or from a hypersensitivity reaction to drugs or a vaccine.3) It is known to have three stages, consisting of acute necrotic stage, thrombotic stage, and fibrotic stage.3)4)
CMR imaging is a very useful tool to diagnose cardiomyopathies, such as eosinophilic myocarditis5) There are a few known CMR findings of eosinophilic myocarditis.6)7) Subendocardial enhancement on LGE images is a characteristic CMR imaging feature, which seems to be present in both necrotic and thrombotic stages of eosinophilic myocarditis.6)7)8)9)10) Because subendocardial enhancement was seen in the acute phase of the disease and one of the patients later showed a disappearance of such enhancement on follow up the CMR imaging in a study by Tani et al.,6) they postulated that subendocardial enhancement may not only represent areas of fibrosis but also myocardial inflammation, vasculitis, or transient fibrosis. T2WI in eosinophilic myocarditis typically reveals high signal intensity lesions in the myocardium, attributable to inflammation and edema. Another characteristic feature is the presence of intracardiac thrombi, usually in the apical portion, because eosinophilic infiltration most often occurs in the apical portion. Denudation of the subendocardium after myocardial necrosis and micro-abscess formation results in the thrombi formation.7) Thrombi can be seen as an intraventricular nonenhancing lesion surrounded by a subendocardial enhancement on the LGE images of CMR.
CMR mapping is an increasingly used tissue characterization technique measuring inherent T1 and T2 values of various tissues, allowing quantification of changes in myocardial signal intensity. It also allows for accurate assessment of myocardial enhancement by measuring the T1 values from post-contrast scans. With these advantages, it is considered a very useful technique in the diagnosis and evaluation of the prognosis of various cardiac diseases.11)
To our knowledge, this is the first report describing T1 and T2 mapping of eosinophilic myocarditis. The increased T2 values on T2 mapping seem to have well reflected the inflammatory edema. Interestingly, T1 mapping demonstrated thrombi and inflammatory regions clearly separate from each other, which usually cannot be differentiated on conventional T1WI. The thrombi showed a low T1 value and the inflammatory regions showed a high T1 value, well reflecting the pathological findings–the methemoglobin/hemosiderin in the thrombi probably caused shortening of the T1 relaxation time, resulting in a low T1 value. In addition the inflammatory region appeared to be collecting inflammatory fluid, which probably caused a high T1 value. Increased ECV of the subendocardial area correlated well with the inflammatory region.
In our case, the LGE images were typical, enabling the diagnosis of eosinophilic myocarditis even without the myocardial mapping. However, in a patient with impairment of renal function, we believe the diagnosis of eosinophilic myocarditis may be possible solely with T1 mapping. Recently, there has been a study demonstrating that an increased T1 value on pre-T1 mapping is characteristic of amyloidosis, which may prove helpful in diagnosing amyloidosis in patients with renal failure.12) We believe that our case provides similar insight into the diagnosis of eosinophilic myocarditis.
In conclusion, although LGE images did demonstrate the apical thrombi, native T1 mapping equally proved useful in depicting the thrombi clearly separate from the myocardium, without contrast enhancement, which may give additional confidence in diagnosing the thrombi. It may also be helpful in patients with renal failure who might not be able to undergo CMR with contrast enhancement but still want to rule out eosinophilic myocarditis.
 XML Download