

 PDF
PDF ePub
ePub Citation
 Print
Print


Introduction
Carbon monoxide (CO) is one of the most well-known toxic air pollutants. It is produced by the incomplete combustion of carbonaceous substances.1)2) Exposure to high levels of CO may induce tissue hypoxia, cause tissue injury and even death. Cardiac toxicity after CO poisoning includes arrhythmias, heart failure and myocardial infarction.3)4)5)6) As these cardiac injuries may increase mortality in patients with CO intoxication, it is very important to detect cardiac injuries at the emergency department (ED). However, the prevalence and clinical course in patients with CO intoxication has been insufficiently reported. Also, there is no study in the literature describing the prediction of cardiac toxicity in patients with CO poisoning. Because the echocardiography is a useful diagnostic tool in the detection of cardiac toxicity, the incidence of left ventricular (LV) systolic dysfunction (LVSD) can be precisely evaluated in the ED.7) The primary aims of this study were to find the incidence of LVSD by echocardiographic examination in all comers to ED with CO exposure, and its clinical course. The secondary aim was to make a clinical scoring system to predict LVSD.
Subjects and Methods
Study population
We made a cohort of CO poisoning and included all consecutive patients with CO exposure visiting the ED in Chungnam National University Hospital, prospectively. The diagnosis of CO poisoning was done with the presence of compatible clinical history of CO exposure and an elevated serum carboxy-hemoglobin level at the time of admission. All patients followed the same protocol to find out the presence of LVSD. Baseline echocardiography was scheduled within the first 6 hours in the emergency department. The mean interval from ED visit to taking echocardiography was 5.2±4.2 hours. Their clinical variables were obtained from patients' interviews and their medical records. If there was a patient with LVSD, the patient was admitted to the intensive care unit to observe clinical course and managed with standard medical care for LVSD including angiotensin converting enzyme inhibitor/angiotensin receptor blocker, and beta-blocker. Diuretics were used in cases with pulmonary edema. The presence of recovery of LVSD were checked by the follow-up echocardiography daily for 3 to 5 days. If there was no recovery of LVSD or presence of regional wall motion abnormality, we recommended taking the coronary angiography to find out significant coronary arterial disease. The study protocol has been reviewed and approved by the institutional review board of Chungnam National University Hospital (IRB no 2013-12-001).
Laboratory analyses
Venous blood samples were taken and the plasma was assayed for N-terminal pro-B type natriuretic peptide (NT pro-BNP) using an established radioimmunoassay. Creatinine kinase (CK), CK-MB, troponin-I, and lactic acid levels were also analyzed together. The carboxyhemoglobin (CO-Hb) level was measured by a CO-oxymeter. An electrocardiography was performed in all patients at the time of arrival with commercially available electrocardiography machines. An expert radiologist (S.S. Kim) who was unaware of other clinical features of the participants confirmed the presence of pulmonary edema on a chest X-ray.
Echocardiography
Standard 2 dimensional echocardiographic examinations with Doppler studies were performed by expert echocardiographers using Vivid 7 or E9 echocardiographic machines with an M4S probe (GE Vingmed, Horten, Norway) and stored digitally. The echocardiograms were systematically reviewed and measured by 2 experienced cardiologists (J-H. Park and B.J. Sun). The 2- and 4-chamber images were used to calculate LV end-diastolic and end-systolic volumes, and LV ejection fraction (LVEF) using modified Simpson's biplane method.8) The presence of LVSD was defined by LVEF less than 50% assessed by biplane Simpson's method. Regional wall motion abnormality (RWMA) was assessed visually by two well-trained cardiologists.
Statistical analysis
Categorical variables are presented as a frequency and percentage. Continuous variables are presented as mean±standard deviation (SD) or median with interquartile range. Categorical variables were compared with χ2 test and continuous variables were compared with Student's t-test. Numerical variables were made binary by the use of cut-points with the goal of defining a simple, easily implemented scoring method. Thresholds for categorization of these numeric variables were specified using generally accepted criteria or best cut-off values from receiver operator characteristic (ROC) curves. A binary logistic regression was used in the prediction of LVSD and a multivariable analysis was performed on parameters that were significant on the univariate analysis. We performed a multivariate analysis with bootstrapping to prevent overfitting of the model.
The clinical scoring with the lowest regression coefficient among 5 variables in the model was assigned a numeric value of 2, and other 4 variables were assigned scores based on the values of their regression coefficients, relative to that of the lowest value. Thus, each of the binary clinical parameters was assigned a score based on the regression coefficient in the multivariable model. This clinical score was derived by summation of the assigned numeric score. The optimal cutoff value of the clinical score for predicting LVSD was determined by the ROC curve analysis. Comparison of areas under the curve (AUC) of the clinical score and other single variables was done with the method suggested by Hanley and McNeil.9) A two-tailed value of p<0.05 was considered significant. All statistical analyses were performed using SPSS 20.0 (IBM Inc., Chicago, IL, USA), MedCalc (version 12.3.0.0, MedCalc Software, Mariakerke, Belgium) and with the assistance of a professional statistician (I.S. Kwon) from our institution.
Results
Patient characteristics
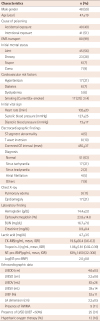
We enrolled a total of 81 patients (48 men, 47±19 years old) with CO exposure who were admitted to our ED from May 2009 to June 2015. The mean carboxy-hemoglobin level was 23.8±14.8%. The etiology of intoxication was intentional in 41 patients (51%), and 36 patients (44.4%) showed altered mentality. Their baseline characteristics are presented in Table 1.
Patients with LV systolic dysfunction
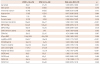
Twenty five of them (31%) showed LVSD and 9 had RWMA. Comparison of clinical parameters according to the presence of LVSD was summarized in Table 2. In the LVSD group, initial heart rate, troponin-I, NT pro-BNP, and serum lactate level were significantly higher. Also, pulmonary edema was more prevalent in the LVSD group. Due to the fact that patients without LVSD were discharged in the ED after receiving emergent management, the hospital duration was significantly longer in the LVSD group (5.1±3.6 vs. 1.3±1.9 days, p<0.001). A follow-up echocardiographic examination was completed for 21 patients, but were unavailable for 4 patients (1 died and 3 refused admission). Of the 21 patients with a completed echocardiographic examination, 18 patients showed complete recovery of LV systolic function in about 3 days (mean 2.8±1.7 days). There were 9 patients with RWMA; Six patients demonstrated complete recovery within 7 days. The remaining 3 patients did not show recovery of RWMA and had to undergo coronary angiography; 2 of them had significant coronary arterial stenosis, which was treated with the coronary artery stenting. The clinical outcomes of this study population are summarized in the Fig. 1.
In the LVSD group, 4 patients also had rhabdomyolysis upon admission. One of them was temporarily treated with continuous renal replacement therapy. Also, there were 7 patients with delayed onset encephalopathy associated with CO poisoning.
Clinical scoring system
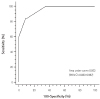
We selected clinical variables based on univariate analysis according to the presence of LVSD (Table 2). Pulmonary edema on an initial chest X-ray showed statistical significance (HR=10.50, 95% confidence interval [CI]=1.997-53.20, p=0.005). The optimal cut-off values of continuous variables were calculated with ROC curve analyses; initial heart rate >100/min (sensitivity=80%, specificity=61%, AUC=0.785, 95% CI=0.680-0.869, p<0.001), NT pro-BNP >100 pg/mL (sensitivity=80%, specificity=68%, AUC=0.789, 95% CI=0.684-0.872, p<0.001), troponin-I >0.1 ng/mL(sensitivity=84%, specificity=75%, AUC=0.867, 95% CI=0.773-0.932, p<0.001) and serum lactic acid >4.0 mg/dL(sensitivity=75%, specificity=71%, AUC=0.740, 95% CI=0.550-0.883, p=0.001). After the multivariate analysis in the prediction of LVSD with 5 clinical parameters, each was assigned a numeric value based on its relative effect in 5 variables with statistical significance. Accordingly, heart rate (>100/min) was assigned a numeric value of 2; lactic acid >4.0 mg/dL, troponin-I >0.1 ng/mL, and NT pro-BNP >100 pg/mL were assigned a value of 3 each; presence of pulmonary edema, a value of 5 (Table 3). A clinical score was constructed by adding the numeric values of the factors identified in each patient and ranged from 0 to 16. Using ROC curve analysis for the prediction of LVSD, a total score of ≥8 showed optimal sensitivity (84%) and specificity (91%) (Fig. 2). The area under the curve of our clinical score was significantly higher than those of other clinical variables (Table 4).
Discussion
The main findings of the current study were LVSD and observed in about 31% (25/81); clinical scoring system combination of initial heart rate >100/min, presence of pulmonary edema on chest X-ray, NT pro-BNP >100 pg/mL, troponin-I >0.1 ng/mL and lactic acid >4.0 mg/dL would increase the diagnostic accuracy in predicting the LVSD.
It is well known that CO-Hb levels do not correlate well with the severity of cardiac and neurologic symptoms in a substantial number of cases. However, the presence of cardiac toxicity is a bad prognostic factor in patients with CO intoxication.10) Cardiac toxicity after CO poisoning includes arrhythmias, pulmonary edema, heart failure, myocardial infarction, and cardiogenic shock.5)10)11)12) If heart failure is present after CO exposure, hyperbaric-oxygen therapy should be recommended with conventional heart failure treatments. With prompt treatment, LVSD can be normalized within several days.6)13) Therefore, regardless of the level of CO-Hb, the evaluation of cardiac function is essential for prevention of cardiac complication or mortality at the ED. Moreover, patients with coronary artery disease are more susceptible to CO-induced cardiotoxicity.14) In this study population, 9 patients showed RWMA. Of them, 3 showed no improvement of RWMA in a follow-up echocardiography, and 2 underwent coronary artery stenting due to myocardial ischemia. The CO poisoning can worsen the preexisting myocardial ischemia caused by significant coronary artery stenosis in these patients.
Currently, several studies reported that myocardial injury after CO exposure can be identified by using electrocardiography and elevation of cardiac biomarker.3)7)13)15) However, electrocardiographic changes suggesting myocardial injury can include sinus tachycardia, and ST or T wave changes. Electrocardiographic changes were not prominent in our study. Echocardiography has been regarded as a good screening tool for detection of CO-induced cardiotoxicity.3)7)16) However, it is not readily available for evaluating cardiotoxicity especially at night.
Tachycardia is the most common clinical sign after acute CO exposure.17) It can be caused as a compensatory response to systemic hypoxemia and decreased cardiac contractile function.
Pulmonary edema may occur in severe CO exposure and is a relatively uncommon feature in CO poisoning.18) Because it is usually associated with smoke inhalation, taking a chest X-ray is mandatory in such patients. In our study, pulmonary edema was found in 9 patients (11%). Pulmonary edema requiring diuretic therapy was more prevalent in the LVSD group.
BNP and NT pro-BNP are good serum biomarkers which have good correlation with symptom severity and prognosis in heart failure patients.19)20)21) Using BNP in the evaluation of dyspnea is useful in many clinical settings, especially in the emergency department.20)21) Maisel et al.19) reported their cut-off value of serum BNP in the detection of heart failure and BNP >100 pg/mL showed sensitivity of 90% and specificity of 79% in the emergency department. In another study, the authors used serum NT pro-BNP concentration in patients with cardiac toxicity after CO exposure. They found serum NT pro-BNP concentration was well correlated with CO-Hb level.22) Our study showed that NT pro-BNP >100 pg/mL had a sensitivity of 80% and a specificity of 68% in the detection of LVSD in patients with CO toxicity.
The evaluation of cardiac markers can be of considerable diagnostic value in the presence of chest discomfort or ischemic electrocardiographic changes. Troponin-I and troponin-T have been successfully used in the diagnosis of CO-induced cardiotoxicity.3)7) Henry et al.7) reported that myocardial injury occurred frequently in patients hospitalized for moderate to severe CO poisoning, and presence of myocardial damage was a significant predictor of mortality. They defined myocardial injury as cardiac troponin-I level ≥0.7 ng/mL or CK-MB ≥5.0 ng/mL. We found that myocardial injury detected by an echocardiograph could occur with a lower level of troponin-I (>0.1 ng/mL) in our study.
We tried to compare baseline characteristics, laboratory, radiographic and electrocardiographic parameters according to the presence of LVSD. The LVSD group had a higher heart rate, a higher prevalence of pulmonary edema, and a higher concentration of cardiac troponin-I, NT pro-BNP and serum lactate levels. Multivariable scoring system including initial heart rate >100/min, presence of pulmonary edema on chest X-ray, NT pro-BNP >100 pg/mL, troponin-I >0.1 ng/mL and lactic acid >4.0 mg/dL can be used to predict LVSD associated with CO poisoning. This scoring system showed a better area under the curve than each variable to detect LVSD. It can be used to screen and rule out the presence of LVSD in ED. If a patient is present with the clinical score of 9, the patient should be screened with an echocardiograph. If patients has a clinical score of less than 4, the sensitivity of 100% in excluding LVSD. So, such patient can be discharged without performing an echocardiography.
Study limitations
There were several limitations in our study. First, a limited number of patients were included only from one hospital. Moreover, there were only 25 patients (31%) with LVSD. This number was insufficient for the multivariate analysis. We performed a multivariate analysis with bootstrapping to prevent overfitting of the model.
Second, most of our study population were transferred to our hospital using the emergency medical system. Use of high concentrations of oxygen during their transport could have influenced measurements o f C O-Hb l evels. A lso, t here w as a possibility that some patients with severe cardiotoxicity after CO exposure might have expired as consequences of CO poisoning. So, we could have a selection bias in our study cohort. However, our cohort could also represent a real clinical practice. Finally, we could not evaluate the long term clinical outcome of CO-induced cardiotoxicity. To overcome these limitations, large multicenter studies, including more comprehensive laboratory, imaging and other assessments are needed.
Conclusion
We found that about 31% of patients showed LVSD associated with CO poisoning, and most of them showed complete recovery within about 3 days. The presence of LVSD was associated with initial heart rate >100/min, presence of pulmonary edema on chest X-ray, NT pro-BNP >100 pg/mL, troponin-I >0.1 ng/mL, and lactic acid >4.0 mg/dL. We made a clinical scoring with these variables to predict LVSD, which may be helpful in detecting LVSD in CO-poisoned patients, especially in small ED without echocardiographic support. Patients with a higher clinical score (≥8) might have LVSD, which can be detected with an echocardiograph.


 XML Download