

 PDF
PDF ePub
ePub Citation
 Print
Print


Introduction
Lichen planus (LP) is a chronic inflammatory disease, which affects the skin, genitalia, mucous membranes, and their extensions.1) Although the etiology and pathogenesis of this entity are still not fully clarified, it is widely believed that impairment in the T-cell mediated inflammatory response plays a role in its pathogenesis.2) The inflammatory setting observed in LP may cause an increase in the serum triglyceride and low density lipoprotein (LDL) cholesterol levels and a decrease in the high density lipoprotein (HDL) cholesterol levels.2)
The frequency of cardiovascular disease is higher in patients with LP, which is believed to be due to chronic inflammation, disorders in lipid metabolism, and increased oxidative stress.2) Recent studies have demonstrated an increased risk of atrial fibrillation (AF) in the presence of chronic inflammatory diseases (e.g., psoriasis, rheumatoid arthritis).3)4)5) There are several clinical, electrocardiographic, laboratory and echocardiographic predictors for the development of AF. P-wave dispersion (PWD) in electrocardiography and atrial electrocardiographic delay measured by echocardiography are the latest promising markers.6)7)
Intra-atrial and inter-atrial conduction times in patients with LP have been assessed based on only PWD on electrocardiography up to now.8) However, studies which enrolled patients with isolated atrial fibrillation and paroxysmal atrial fibrillation revealed that, measurement of echocardiographic delay was more useful than electrocardiography measurement of PWD in the prediction of atrial fibrillation.9) In this study, we aimed to evaluate, for the first time, intra-atrial and inter-atrial conduction times with both electrocardiographic PWD and echocardiographic electromechanical delay in patients with LP.
Subjects and Methods
Study population
In this study, we enrolled 72 consecutive patients from two different centers who visited the Dermatology Clinic with the diagnosis of LP. The control group was selected in a 1:1 ratio from 70 patients in an age and sex matched manner. The criteria for exclusion in the patient group included the following: any kind of inflammatory diseases, chronic obstructive pulmonary disease, coronary artery disease, valvular heart disease, cardiomyopathy, pulmonary hypertension, abnormal serum electrolyte values, treatment with an antiarrhythmic drug, prior pacemaker implantation, bundle branch block or atrioventricular or intraventricular conduction abnormalities on electrocardiogram (ECG), history of permanent or paroxysmal atrial fibrillation, pericarditis, chronic systemic diseases including renal failure, anemia, thyroid disease, poor echocardiographic imaging quality, and/or presence of infectious disease within 1 week of laboratory and echocardiographic assessment. All the patients were in sinus rhythm. The participants' weights and heights were measured, and their body mass indexes (kg/m2) were calculated. Their blood pressures were measured after a 5-minute rest and again after 10 minutes, and the average of the two measurements was recorded. Two-dimensional and Doppler echocardiographic measurements were performed. Serum triglycerides, LDL-cholesterol, glucose levels, and high sensitive C-reactive protein (hsCRP) levels were assessed in samples collected between 8 a.m. and 9 a.m. after a 12-hour fasting period. The study conformed to the standards set by the Declaration of Helsinki, and ethical approval was obtained from the Medical Ethical Committee of Fırat University (Reference No: 02/12/2014-20-22). Written informed consent was obtained from each participant.
Electrocardiographic analysis
All subjects underwent 12-lead ECG recording (Nihon Kohden Corporation, Tokyo, Japan) after a 20-min resting period in the supine position at a paper speed and amplitude of 50 mm/s and 2 mV/cm, respectively. The P-wave duration was measured manually by using calipers and a 10X magnifying lens for evaluation of the electrocardiographic deflections in all simultaneously recorded 12 leads of the surface ECG by two investigators who were blinded to the participants. In each lead, the mean values for the three complexes were calculated. The onset of the P-wave was defined as the junction between the isoelectric line and the beginning of P-wave deflection and the offset of the P-wave as the junction between the end of the P-wave deflection and the isoelectric line. The Pmax measured in any of the 12 leads of the surface ECG was considered to be the longest atrial conduction time. The difference between the maximum (Pmax) and minimum (Pmin) P-wave durations was calculated and it was defined as P-wave dispersion (Pd=Pmax–Pmin). In order to improve accuracy, all measurements were performed with calipers and a magnifying lens to define ECG deflections, as described previously.10)
Echocardiographic analysis
Conventional echocardiography
The echocardiographic examination was performed at rest, with the patient in the left lateral decubitus position, using an ECG machine (iE33 xMatrix Echocardiography System, Philips, New York, NY, USA) equipped with a 2–4 MHz probe. This test was performed by two experienced echocardiographers, who were blinded to the clinical data. For each measurement, the mean of at least three consecutive cardiac cycles was considered. Left ventricular enddiastolic, left ventricular end-systolic, and left atrial end-systolic diameters were measured in M-mode in the parasternal long-axis views according to the standards of the American Society of Echocardiography.11) Left ventricular ejection fraction was calculated via a modified biplane Simpson's method from apical four- and two-chamber views. Left and right atrial areas were calculated from the apical chamber view.11) Right ventricular diameter and tricuspid annular plane systolic excursion (TAPSE) measurements were made in M-mode according to the guidelines.12) From the suprasternal window, color M-mode Doppler imaging was performed with the cursor parallel to blood flow in the descending aorta. The color Doppler Nyquist limit was set to 30-50 cm/s, switching to the M-mode with a recorder sweep rate of 200 mm/s. When the isovelocity slope was unclear, the baseline aliasing velocity was changed. Aortic propagation velocity was calculated by dividing the distance between points corresponding to the beginning and end of the propagation slope by the duration between these two points. Then, the mean of the three calculations was considered.13) Carotid intima media thickness (CIMT) was measured with 7-MHz transducer attached to the available machine (Vivid S5, GE Vingmed Ultrasound AS, Hortan, Norway). Images were obtained bilaterally from the distal part of the common carotid artery. The two bright echogenic lines in the arterial wall were defined as the intima-media lines. At the end-diastole (peak of the R wave on ECG), CIMT was measured between these two lines, and the average of the three measurements was taken.13)
Atrial electromechanical coupling
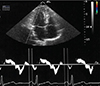
Continuous ECG recording was performed from a single lead. Tissue Doppler echocardiography was performed using transducer frequencies of 3.5-4.0 MHz, adjusting the spectral pulsed Doppler signal filters until a Nyquist limit of 15-20 cm/sec was achieved. The monitor sweep speed was set at 50-100 mm/sec to optimize the spectral display of myocardial velocities. In the apical four-chamber view, the pulsed Doppler sample volume was subsequently placed at the level of left ventricular lateral mitral annulus, septal mitral annulus, and right ventricular tricuspid annulus. Tissue Doppler pattern was characterized by a positive (i.e., above baseline) myocardial systolic wave (S) and two negative (i.e., below baseline) diastolic waves—early (E) and atrial (A). Efforts were made to align the pulsed wave cursor in order to maintain the Doppler angle of incidence as close to zero as possible in relation to the direction of these walls. E deceleration time and isovolumetric relaxation time (IVRT) were measured. IVRT was defined as the interval between the end of the aortic outflow and the beginning of the mitral inflow signal. Atrioventricular annulus motions were recorded simultaneously with electrocardiogram in lead II during sinus rhythm to analyze the temporal relationship between atrial electrical phases and myocardial motion. The intervals from the onset of P-wave on surface ECG to the beginning of A-wave (PA), representing atrial electromechanical delay (Fig. 1) were obtained from lateral mitral annulus, septal mitral annulus, and right ventricular (RV) tricuspid annulus and designated as lateral PA, septal PA, and RV PA, respectively. The timing of mechanical activation of each reference point, namely, lateral mitral, septal mitral, and RV tricuspid annuli depends on the distances of these points from the sinus node. The difference between septal PA and RV PA was defined as intra-right atrial mechanical delay (septal PA-RV PA); the difference between lateral PA and septal PA was defined as intra-left atrial mechanical delay (lateral PA-septal PA); and the difference between lateral PA and RV PA (lateral PA-RV PA) was defined as inter-atrial mechanical delay.14)
Statistical analysis
All statistical analyses were performed by using SPSS package program ver.10.0 (SPSS Inc., Chicago, IL, USA). Continuous variables were reported as means±standard deviation and categorical variables were reported as percentages. Student's t-test was used for comparison of normally distributed variables and Mann-Whitney U-test was used for non-normally distributed variables. Categorical variables were compared by the χ2 test or Fisher's exact test as appropriate. Pearson's correlation analysis was used for correlations. p values less than 0.05 were considered to be statistically significant.
Results
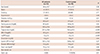
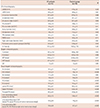
Seventy-two LP patients were enrolled in the study, of whom 43 were men (59.7%). The mean age of the patients was 44.0±16.7 years. The control group consisted of 70 age and sex matched healthy volunteers. Clinical characteristics and echocardiographic findings of the two groups are summarized in Tables 1 and 2. Age, sex, body mass index, presence of diabetes and hypertension, smoking status, baseline systolic and diastolic blood pressures, heart rate levels, and left ventricular (LV) end-diastolic diameter, LV end-systolic diameter, LV mass, LA diameter, LA volume index, RA area index and LV ejection fraction, and deceleration time of early phase of mitral valve flow and IVRT, and TAPSE and RV diameter were similar between the two groups. However, patients with LP exhibited significantly higher levels of LDL-cholesterol, triglycerides, and hsCRP, and lower levels of HDL-cholesterol. Oral steroid use was also significantly higher in the LP group than in the control group.
Atrial electromechanical delay measurements are shown in Table 2. Patients with LP had significantly prolonged lateral PA, septal PA, tricuspid PA, and intra- and interatrial electromechanical delays compared with the control group (p<0.001). The intra-atrial and inter-atrial delays were found to be significantly correlated with hsCRP (r=0.60, p<0.001 and r=0.58, p<0.001, respectively).
Pmax and Pmin values are shown in Table 3. PWD was significantly higher in patients with LP (p<0.001). PWD was also found to be significantly correlated with hsCRP (r=0.51, p<0.01).
Discussion
In this study, we showed that patients with LP had significantly higher PWD, intra and inter-atrial delays, and higher LDL and hsCRP levels when compared to the healthy controls. LP is a chronic inflammatory autoimmune mucocutaneous disease. Although the exact pathogenesis of the disease is still unclear, autoantibodies and T-cell mediated cytotoxicity have been implicated,15) and most of the cardiovascular disorders share similar pathogenetic mechanisms, such as chronic inflammation, endothelial dysfunction and increased oxidative stress.16)
In their review, Michelucci et al17) told that prolonged PWD has a predictive value in the development of AF in patients with or without apparent heart disease under various circumstances. Our results may be important for the early detection of subclinical cardiac involvement in LP patients. Increased hsCRP level and significant correlation between hsCRP levels and PWD in this study indicated that inflammation might be a possible mechanism for increased PWD in LP. Similarly, in another study, hsCRP and PWD were shown to be correlated with each other in LP patients.8) Additionally in our study, we found increased intra-atrial and interatrial delays in patients with LP, which were correlated with hsCRP. The echocardiographic measurement of atrial electromechanical delay has been shown to be correlated with the development of AF in several patient groups.18)19) Therefore, according to our study results, we can only hypothesize that LP patients with ongoing inflammation might have atrial electro-mechanical delay with a risk of AF development.
The major limitation of our study is its cross-sectional design with lack of follow-up of patients. The number of patients enrolled in our study is also small. As a result, we could not demonstrate whether prolongation of intra and inter atrial electro-mechanical delays predicted AF in LP patients. Another limitation is that we manually calculated P-wave measurements by a magnifying lens as in previous studies, instead of using computer-assisted P-wave calculation methods.
In conclusion, although LP is a disease characterized by increased inflammatory activity, there are no existing clinical data on whether atrial inflammation is higher in these patients. Our study is the first in this regard to suggest that atrial electro-mechanical coupling detected by echocardiography is impaired in concordance with increased inflammatory markers.

 XML Download