

 PDF
PDF ePub
ePub Citation
 Print
Print


Introduction
Coronary artery disease (CAD) is a progressive disease characterized by various symptoms and findings ranging from angina pectoris to sudden cardiac death as a result of decreased blood flow during rest or exercise due to the characteristics of coronary artery lesions.1) Diagnosis of CAD is made by non-invasive (electrocardiography [ECG], exercise stress test, myocardial perfusion scintigraphy, coronary computed tomography) and invasive (coronary angiography) methods.2)
Dilaveris et al.3) studied P wave intervals in the ECG. P wave intervals were measured in all derivations and the difference between the longest P wave (Pmax) and the shortest P wave (Pmin) was calculated as P wave dispersion (PWD). That study demonstrated that Pmax and PWD evidently increased among patients with a history of idiopathic paroxysmal atrial fibrillation as compared to healthy normal controls. The QT interval was defined as a measure of the time between the initiation of the Q wave and the end of the T wave. QT interval varies with heart rate and is calculated with Bazett's formula as corrected QT (QTc). The difference between the longest QT interval (QTmax) and the shortest QT interval (QTmin) on the ECG is defined as QT dispersion (QTd). If QTc intervals are used, then it is defined as QTc dispersion (QTcd). QTd is a parameter measured non-invasively on the surface ECG and indicates heterogeneity of ventricular repolarization. Increased QTd has been found to be associated with serious arrhythmias and sudden death risk in the ischemic or non-ischemic cardiac disease group.3) A report published by Day et al.4) in 1990 stated that QTd was a direct criterion of heterogeneity of myocardial repolarization. The studies did not show significant differences between male and female patients in terms of QTd.4) Also, it was proved that age did not significantly affect QTd.5) QT dispersion ratio (QTdR)–defined as QTd divided by cardiac cycle length- is considered to be a more valuable parameter than QTd in terms of predicting ventricular arrhythmia.6) It was demonstrated that QTd increased in patients with acute myocardial infarction as compared to normal people.7) Some studies indicated that QTd increased in the chronic phase of myocardial infarction and in patients with chronic CAD as compared to normal people although not as much as in patients with acute myocardial infarction.8) It was shown that QTd was also associated with increased cardiovascular mortality and morbidity in patients with diabetes and peripheral vascular disease and end-stage renal disease.9)10)
For measurement of the electrocardiographic parameters, manual and automatic measurement techniques are used. But, it has not yet been demonstrated that automatic measurement techniques are superior to manual measurement techniques.11) One of the most crucial prognostic factors in CAD patients is the severity of CAD, which was revealed by the Coronary Artery Surgery Study.12) The scoring technique used in our study was defined by Gensini,13) in which the scores are obtained according to the degree of angiographic stenosis and multiplied by the coefficients pre-defined for each main coronary artery segment and the sums are added.
The aim of our current study was to evaluate the correlation between ECG parameters and severity of CAD and to examine whether these non-invasive parameters were able to detect coronary artery disease or not.
Subjects and Methods
Study population
This study was designed as a cross-sectional observational study that included 250 patients who were admitted to our outpatient clinic between April 2012 and September 2012 and were referred for coronary angiography upon suspicion of stable CAD. A total of 512 patients with CAD were screened, and 250 patients who fulfilled the inclusion and exclusion criteria were included in the study. Our study was assessed and approved by the Research Ethics Committee of Medicine Faculty of Istanbul Bilim University (approval number: 14.03.2013/03-11). All data in hospital archives of the participating patients about the pre-coronary angiography period was examined. Patients' demographic characteristics (age, gender), risk factors such as hypertension (HT), diabetes mellitus (DM), smoking and family history, left ventricular ejection fraction, and left ventricular hypertrophy, and biochemical and hemogram values were recorded.
Coronary angiography
On coronary angiography, narrowing of coronary arteries by ≥50% was accepted as significant CAD, and accordingly, patients were classified into the following five groups: Group 1: those with normal coronary arteries, Group 2: those with non-critical coronary lesions (narrowing of coronary arteries lesser than 50%), Group 3: those with one vessel disease (narrowing of one major coronary artery greater than ≥50%), Group 4: those with two vessel disease (narrowing of two major coronary arteries greater than ≥50%), Group 5: those with three vessel disease (narrowing of three major coronary arteries greater than ≥50%). Severity of CAD was established using Gensini score index of stenosis obtained from coronary angiography.13) According to the scoring system designed by Gensini,13) 1 point is given for 0-25% stenosis, 2 points are given for 25-50% stenosis, 4 points are given for 50-75% stenosis, 8 points are given for 75-90% stenosis, 16 points are given for 90-99% stenosis, and 32 points are given for 100% narrowing. Then, the scores obtained according to the degree of angiographic stenosis are multiplied by the coefficients pre-defined for each main coronary artery segment and the sums are added.
Electrocardiography measurements
ECG of the patients was assessed before angiography. The measurements were performed at a speed of 25 mm/sec by a standard electrocardiography machine (Nihon Kohden Corporation, 1-31-4, Nishiochiai, Shinjuku-ku, Tokyo, Japan). The onset of P-waves was determined by the point of initiation of P-wave deflection on the isoelectric line, and the ending of P-waves was determined by the point of ending of P-wave deflection on the isoelectric line. Pmax was defined as the longest P wave and Pmin was defined as the shortest P wave on 12 lead ECG and the difference between Pmax and Pmin was defined as PWD. The QT interval was measured between the onset of the Q wave and the end of the T wave on the isoelectric line in milliseconds and the lowest point between T and U waves was accepted as the end of the T wave in ECGs with U waves. Derivations that could not be clearly established were not analyzed. It was necessary that all of the subjects should have the measurements of QT intervals for at least 9 out of the 12 derivations. According to heart rates, using Bazett's formula (QT/√R-R), QTc was measured. QTcd was measured by calculating the difference between the QTcmax and QTcmin, and QTdR was calculated by dividing the QTd by the cardiac cycle length and obtained using the cardiac cycle formula (QTd/R-R-ms)×100. All of the measurements were manually performed using a magnifier.
Inclusion criteria
The individuals without a history of any known cardiovascular disease (previous myocardial infarction, percutaneous coronary intervention, coronary artery bypass-grafting) and with preserved left ventricular function were included in the study.
Exclusion criteria
The individuals with a history of cardiovascular disease, valvular heart disease, cardiomyopathy, congestive heart failure, cardiac dysrhythmia or heart conduction disorders, permanent pacemakers, antiarrhythmic drugs or drugs that affect the autonomic nervous system, pregnancy, severe organ failure (kidney, liver) or organ malignancies were excluded from the study.
Statistical analyses
Statistical analyses were performed using SPSS 21.0 software for Windows (SPSS Inc., Chicago, IL, USA). All statistical comparisons were performed using the student's t-test. The unpaired t-test was also validated using the non-parametric Mann Whitney U tests. Chi-square test or Fisher exact test was applied for the comparison of categorical variables. The values were expressed as mean±standard deviation or the median and the inter-quartile range (range from the 25th to the 75th percentile). An analysis of variance was used to compare continuous variables. The subsequent post hoc evaluation was performed by the Bonferroni method. Pearson's correlation was used for numerical data. Spearman's correlation was used for nominal data. To assess the diagnostic accuracy, we performed the receiver operating characteristic (ROC) curve analysis. The area under the ROC curve (AUC) was then estimated. p values<0.05 were considered to be statistically significant.
Results
A total of 512 patients with CAD were screened, and 250 patients who fulfilled the inclusion and exclusion criteria were included in the study.
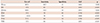
The general characteristics of the study groups are shown in Table 1. Sixty-two participants were females (24.8%) while 188 participants were males (75.2%), and the average age of the patients was 57.9±8.5 years. Age and gender distribution did not differ among groups. When the prevalence of comorbid diseases such as HT, DM and hyperlipidemia was compared among the groups, no difference was observed. There were no differences among the groups in terms of smoking and alcohol consumption. Family history was not different among the groups.
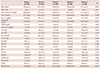
Table 2 demonstrates the laboratory and clinical characteristics of the patients. When echocardiography findings were compared, it was observed that left atrial dimension, right atrial dimension, left ventricular end-diastolic dimension, and left ventricular end-systolic dimension did not differ among the groups. Gensini score was found to be the lowest in Group 1 and the highest in Group 5 (p<0.001).
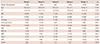
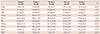
Table 3 presents ECG findings of the patients. Group 1 had the lowest Pmax and PWD, while Group 5 had the highest values of these parameters (p<0.001 and p<0.001, respectively). QTmax and QTd were lowest in Group 1 (p=0.003 and p<0.001, respectively). QTcmax was lowest in Group 2 (p<0.001). QTcd and QTdR were lowest in Group 1, while these values were highest in Group 5 (p<0.001 and p<0.001, respectively). There were no differences among the groups in terms of Pmin, QTmin, and QTcmin intervals.
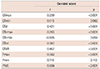
There were positive correlations between Gensini score and QTmax (r=0.239, p<0.001), QTd (r=0.421, p<0.001), QTcmax (r=0.263, p<0.001), QTcd (r=0.387, p<0.001), QTdR (r=0.467, p<0.001), Pmax (r=0.582, p<0.001), and PWD (r=0.656, p<0.001). In Table 4, the correlations between Gensini score and ECG findings of the patients are presented.
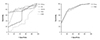
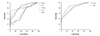
It was observed that the best ECG parameter that differentiated group 1 and group 2 from the groups with significant stenosis was QTdR (AUC 0.846, p<0.001) (Table 5 and Fig. 1). QTdR was also the parameter that differentiated a coronary artery with <50% narrowing from a coronary artery with ≥50% narrowing (AUC 0.858, p<0.001) (Table 6 and Fig. 2).
Discussion
In our study, we identified that ECG parameters including PWD, Pmax, QTd, QTcd, QTdR had significant correlations with Gensini score. It was found that as the severity of the CAD increased in stable angina pectoris patients with preserved left ventricular function, a positive correlation with Pmax, PWD, QTmax, QTd, QTcd, QTcmax, QTdR was detected. It was shown that the best ECG parameter that enabled differentiation between Group 1 and Group 2 and groups with significant stenosis (Group 3, 4 and 5) was QTdR. QTdR was also the best parameter that differentiated coronary arteries with <50% narrowing from the coronary arteries with ≥50% narrowing. Sudden cardiac death and severe arrhythmia are the most important precursors of cardiovascular risk among the patients with CAD. Prospective studies demonstrated that sudden cardiac death occurred within the first hour of initial symptoms, and it was the first sign in more than 25-30% of the CAD patients.14)15) Left ventricular dysfunction that occurs due to ischemic heart disease and ventricular arrhythmias are mostly blamed for mortality.16)17)18)
It is known that CAD is an independent risk factor for atrial fibrillation (AF). AF is more commonly seen during acute coronary events and in patients with stable coronary artery disease compared to the normal population. PWD and Pmax indicate intra-atrial conduction heterogeneity and elongation of PWD and Pmax is clinically associated with increased AF prevalence.3) Non-invasive early diagnosis of AF prevents many unwanted complications in patients with CAD. In the current study, the lowest PWD and Pmax values were detected in Group 1, while the highest values were seen in Group 5. The Gensini score is directly proportional to the extent of coronary artery disease, and this supports our findings which showed a positive correlation between Gensini score and Pmax and PWD.
After the introduction of the definition of asynchronism of ventricular repolarization as heterogeneity of the QT interval by Day et al.4) for the first time, QTd was used clinically. Kautzner and Malik19) demonstrated that QTd alone was more correlated with ventricular arrhythmia risk than QT interval. Elongated QTd is an indicator of high risk for severe cardiac arrhythmia and sudden cardiac death.20)21) QTd is a parameter that can predict sudden cardiac death risk even among the healthy individuals.22) Besides, QTdR, which was defined as QT dispersion divided by cardiac cycle length, was demonstrated to be a more valuable parameter than QTd in predicting ventricular arrhythmia.6) Akyuz et al.23) found that impaired and heterogeneous electrical activity caused by myocardial ischemia in ventricles may increase the cQTd and QTdR values among the patients with CAD. Repolarization impairments due to ischemia and regional fibrosis caused by chronic ischemia may be the reasons for increased ECG parameters detected in patients with CAD.24) Zareba et al.25) pointed out that QTd increased in patients with CAD and it was an independent risk factor for arrhythmic cardiac deaths. Likewise, the study by Batur et al.26) reported a similar result. Although Lowe et al.27) found that the QTd interval was longer in patients with three vessel disease, they could not find a correlation between the number of affected vessels and QTd. However, the study by Sporton et al.28) reported that there was a correlation between the number of coronary lesions and QTd interval. In the current study, there was a positive correlation between the presence and severity of CAD and QTmax, QTd, QTcmax, QTcd, and QTdR variables.
Study limitations
Although our study provided some invaluable findings, it has some limitations. The limitations of our study were that it was conducted in a small number of patients, it was designed as a cross-sectional study, and patients were not followed up in the long run.
Conclusion
In conclusion, our data demonstrated that QTdR was the best ECG parameter to differentiate patients with normal coronary arteries and non-critical coronary lesions from patients with significant stenosis. It was also observed that QTdR was the best ECG parameter to distinguish coronary arterial narrowing lesser than 50% from stenosis greater than 50%. Apart from the proved ability of PWD, Pmax, QTd, QTcd, QTdR parameters in predicting arrhythmia, we can conclude that these parameters may be used as non-invasive screening tools in patients who need advanced cardiac testing for CAD.

 XML Download