

 PDF
PDF ePub
ePub Citation
 Print
Print


Introduction
Hypertension is a worldwide epidemic, affecting approximately one billion people.1) Hypertension is also prevalent in Korea, with nearly one in three individuals suffering from this chronic condition.2) Public health efforts have focused on blood pressure (BP) control due to its close association with advanced cardiovascular diseases (CVDs)3)4)5) and other associated comorbidities and long-term sequelae, which accompany the economic burden of high healthcare utilization and increased mortality risk.6)
Such public health efforts have largely involved cardiovascular risk factor control in order to reduce or delay the development of detrimental CVDs. Lifestyle and behavioral risk profiles are often promoted in an effort to reduce adverse cardiovascular outcomes.6)7)8)9)10) Among the risk control strategies, weight management is of particular interest in hypertension management and the prevention of CVDs or associated complications. According to a recent analysis of national data, one in three persons in Korea is obese, which has increased from 26.0% in 1998 to 31%-32% over the past 7 years.2)11)12) Studies have indicated that obesity puts individual at higher risk of hypertension or metabolic syndrome.13)14)15)16)
The impact of weight burden on the development of cardiovascular disease remains strongly linked to the structural and functional changes in the left ventricle (LV), which becomes overstrained by the concomitant presence of obesity and hypertension causing progressive cardiac dysfunction.15)16)17) In hypertensive individuals free of CVDs, abnormal LV relaxation was 2.3-fold greater in those with concentric LV hypertrophy, compared to those with normal LV geometry; prolonged LV relaxation was also found to show an independent association with concentric LV hypertrophy.18) Weight burden increased the risk of LV diastolic dysfunction by 2.13 times in the overweight group and 3.1 times in the obese group compared with the normal weight group.17)
The modifiable risk of obesity also induced hemodynamic and circulatory alterations influencing cardiorespiratory fitness for exercise capacity, reducing exercise time, and functional capacity.19) However, in a comparative study examining the effect of obesity on LV diastolic function during submaximal exercise in persons with hypertension (age- and sex-matched obese hypertensives with a normal LV structure, non-obese hypertensives, and non-obese normotensive controls), the impact of obesity on resting diastolic dysfunction, given a normal LV structure, was not significant; the risk of diastolic dysfunction was also reduced after exercise in hypertensive patients.20)
Knowledge gaps necessitate additional empirical evidence regarding whether hemodynamic indices, such as hypertension and cardiac function, affect exercise capacity and to determine whether their adverse impacts intensify with the concomitant presence of obesity and high BP (HBP), or both. Therefore, the purpose of this study was to examine the association of obesity, HBP, and cardiac function and the impact of these parameters on exercise capacity in Korean adults. Specific aims were (1) to examine the association between weight burdens (indicated by body mass index, BMI), BP, cardiac function, and exercise capacity in Korean adults grouped by normal control, obese, hypertensive, and obese hypertensive persons; (2) to determine the parameters of cardiac function that predict exercise capacity in normal control, obese, hypertensive, and obese hypertensive persons; and (3) to examine cardiac function and exercise capacity in obese hypertensive persons as compared with their counterparts.
Subjects and Methods
Study design and subjects
Using a retrospective study design, medical records were reviewed to examine the association between obesity, HBP, and cardiac function, and their impact on exercise capacity in Korean adults. Among patients who underwent echocardiography and treadmill exercise test (TMT), subsets were grouped according to four categories: normal control, obese, hypertensive, or obese hypertensive, using defined parameters, including for obesity (BMI>25 kg/m2) and HBP (systolic BP/diastolic BP, SBP/DBP≥140/90 mmHg).
Subjects were enrollees in a university-affiliated outpatient clinic. Eligibility criteria included Korean adults who (1) were 18 years or older and (2) underwent echocardiography and TMT. For normal control, subjects met the criteria of (1) and (2) and additional criteria, including normal weight and BP. For the obese group, subjects met the criteria of (1) and (2) as well as (3) BMI 25 kg/m2 or over. For the hypertensive group, subjects met the criteria of (1) and (2) and (4) HBP of ≥140/90 mmHg in repeated measurements (using the standardized protocol for BP measurement in a sitting position) and (5) a diagnosis of hypertension without CVDs or taking antihypertensive drugs. For the final obese and hypertensive study group, subjects met criteria for both subgroups.
Subjects (1) with a documented history of CVDs or on medication for treatment of CVDs, (2) had a diagnosis of diabetes mellitus, or chronic kidney disease (glomerular filtration rate<60 mL/min/1.73 m2, creatinine>1.6 mg/dL), or on renal replacement therapy were excluded. The institutional review board of a university affiliated hospital approved the study protocol (#GIRBA2471).
Study variables
The patients were classified according to four categories by measure of BMI and BP: healthy, obese, hypertensive, and obese hypertensive groups. Each variable was defined as follows:
(1) Obesity: obesity was defined by the Korean Society for the Study of Obesity using the cut-off point of BMI 25 kg/m2.21)
(2) Hypertension: to determine high BP, BP was measured twice while sitting and either 140 mmHg or over for SBP or 90 mmHg for DBP both times.
(3) Echocardiographic data: echocardiographic data were obtained for the evaluation of cardiovascular structure and function in normal control, obese, hypertensive, or obese hypertensive individuals. Echocardiographic parameters of interest in this study included left ventricular ejection fraction (LVEF), diastolic function as determined by peak velocity of early mitral inflow (E velocity), peak velocity of late mitral inflow (A velocity), early diastolic mitral annular velocity (Ea), E/A ratio, E/Ea ratio, deceleration time (DT) of early mitral inflow, LV mass, or LV mass index.22)
(4) Exercise capacity: the TMT results were obtained for evaluation of exercise capacity. In the present study, parameters of exercise capacity of interest were total exercise time, metabolic equivalents (METs), maximal oxygen consumption (VO2 max), SBP, DBP, and heart rate.23)
Statistical analysis
SPSS for Windows version 16.0 (SPSS Inc., Chicago, IL, USA) was used for data analysis. Descriptive statistics were completed for all study variables, presenting as mean and standard deviation, with ranges for continuous variables, and percentages for categorical variables. One-way analysis of variance tests were performed to examine the differences in demographics and clinical presentation. To examine the association between obesity, BP, cardiac function, and exercise capacity in Korean adults, the Pearson's coefficient correlation and analysis of covariance analyses were performed. To determine the predictive values of cardiac function indices for exercise capacity in each group, a series of multiple regression analyses were performed. To examine the association between the cumulative burdens of obesity and hypertension with cardiac function and exercise capacity, logistic regression analyses were performed with the obese and hypertensive group having the highest probability of cardiac dysfunction and poor exercise capacity as compared to the reference group of risk-free or single risk of having either obesity or hypertension.
Results
A total of 432 individuals (normal control=120, obese=87, hypertensive=123, and obese/hypertensive=102) were included in this study. Demographic differences across four groups were found in age with normal controls (mean±standard deviation [SD]=51.3±11.4) and obese persons (mean±SD=51.3±8.8) being younger, overall, compared to the hypertensive (mean±SD=54.5±9.3) and obese hypertensive subjects (mean±SD=54.7±8.9) (F=3.99, p=0.008); the proportion of female subjects did not differ across the four groups, with 51.7%, 51.7%, 60.2%, and 49.0% being female in the normal control, obese, hypertensive, and obese hypertensive groups, respectively (p=0.35). Significant differences in BMI were found, with significantly higher BMI in the obese hypertensive group, compared with the normal control and hypertensive as well as the obese groups (F=247.49, p<0.001). Significant differences in BP were observed, with higher SBP in the obese hypertensive group compared with the normal control and obese groups; the hypertensive group also had higher SBP than the normal control group (F=10.46, p<0.001). The obese hypertensive group had higher DBP than did the normal control and obese groups; the hypertensive group also had higher DBP than the normal control group (F=11.25, p<0.001).
Association between body mass index, blood pressure, cardiac function, and exercise capacity
Table 1 shows the association between BMI, BP, cardiac function, and exercise capacity across the four groups. After controlling for age and sex, significant differences in echocardiographic indices were found. The obese hypertensive group had lower Ea and E/A ratio; greater E/Ea ratio, DT, LV mass, and LV mass index compared to their normal control, obese, and/or hypertensive counterparts (all p<0.05). Those with a single risk factor of obesity or hypertension or risk of both had significantly lower Ea and greater LV mass than did the normal control (all p<0.001). However, no significant differences in cardiac function indices were observed between the obese and hypertensive groups.
Table 1
Differences in body mass index, blood pressure, cardiac function indices, and exercise capacity across normal control, obese, hypertensive, and obese hypertensive groups
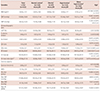
*adjusted for age and sex; a series of analysis of covariance were conducted with the Bonferroni correction which was an adjustment of p for reduction of the problem associated with multiple comparisons. SD: standard deviation, BMI: body mass index, SBP: systolic blood pressure, DBP: diastolic blood pressure, LVEF: left ventricular ejection fraction, E: peak velocity of early mitral inflow, Ea: early diastolic mitral annular velocity, A: peak velocity of late mitral inflow, DT: deceleration time of early mitral inflow, LV: left ventricular, METs: metabolic equivalents, VO2 max: maximal oxygen consumption, HR: heart rate, BPM: beats per minute
After controlling for age and sex, significant differences in exercise capacity indices were found in that the obese group had shorter exercise times, lower METs, and lower VO2 max compared with the normal control, hypertensive, or both groups (all p<0.05). However, post hoc analyses showed no significant group differences between obese hypertensive group and the hypertensive groups. Maximal SBP/DBP and heart rate increased in the hypertensive group as well as the obese hypertensive group compared with the normal control group (all p<0.001).
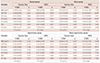
Based on an echocardiographic index of E/Ea>8.0 or E/A ratio<1.0 or >1.8, 324 (75.0%) or 276 (63.9%) had diastolic dysfunction, respectively. Diastolic dysfunction was identified by E/Ea criteria in 96 subjects of the normal control group (78.0%), 73 subjects of the obese group (60.8%), 88 subjects of the hypertensive group (74.7%), and 90 subjects of the obese hypertensive group (88.2%) with a significant association between obesity and/or hypertension and diastolic dysfunction (χ2=22.99, p<0.001). Diastolic dysfunction was identified by E/A ratio in 79 subjects of the normal control group (64.2%), 63 subjects of the obese group (52.5%), 55 subjects of the hypertensive group (63.2%), and 79 subjects of the obese hypertensive group (77.5%) with a significant association between obesity and/or hypertension and diastolic dysfunction (χ2=14.90, p=0.002) (Table 2).
Table 2
Left ventricular diastolic function across the normal control, obese, hypertensive, and obese hypertensive groups

Impact of cardiac function on exercise capacity in each group
In a series of multiple regression analyses, after controlling for age and sex, BMI, BP and, cardiac function indices did not predict exercise capacity in normal control and hypertensive groups. However, in the obese group, delayed DT of the E wave was a significant predictor of longer exercise time (β=0.30, p=0.012), accounting for 28% of the variance of exercise time. In addition, lower LVEF (β=-0.19, p=0.049) and delayed DT (β=0.25, p=0.028) were significant predictors of higher METs, accounting for 32% of the variance in METs. In the obese hypertensive group, an increased E/A ratio was a significant predictor of greater METs (β=0.37, p=0.013), accounting for 29% of the variance in METs (Table 3).
Table 3
The impacts of cardiac function indices on exercise capacity (exercise time and metabolic equivalents)
For an entire sample, Exercise time - R2=0.162 (F=10.051, p<0.001); METS - R2=0.270 (F=14.526, p<0.001). *indicates significant at p<0.05. METs: metabolic equivalents, SE: standard error, BMI: body mass index, LVEF: left ventricular ejection fraction, E: peak velocity of early mitral inflow, A: peak velocity of late mitral inflow, DT: deceleration time of early mitral inflow, Ea: early diastolic mitral annular velocity, LA: left atrium
Cardiac function and exercise capacity in the obese hypertensive as compared to the non-obese or non-hypertensive
Table 4 shows comparison of cardiac function and exercise capacity indices between the obese hypertensive group vs. the reference group (persons with risk free or single risk of obesity or hypertension). Obese hypertensive persons were nearly three times more likely to have diastolic dysfunction using the cutoff point of E/Ea ratio>8 (odds ratio [OR]=2.96, p=0.001) and twice as likely to have diastolic dysfunction using the cutoff point of E/A ratio<1 or >1.8) (OR=2.16, p=0.006) compared to the reference group. However, no significant differences in exercise capacity indices were observed between the obese hypertensive patients compared with their counterparts.
Table 4
Cardiac function indices and exercise capacity among persons with concomitant presence of obesity and hypertension as compared to the reference

Reference group refers to persons with risk free or single risk of obesity or hypertension. *adjusted for age and gender. CI: confidence interval, E: peak velocity of early mitral inflow, Ea: early diastolic mitral annular velocity, A: peak velocity of late mitral inflow, METs: metabolic equivalents
Discussion
Obesity is a known risk factor for diastolic dysfunction.15)16)17) In the present study, diastolic dysfunction and lower exercise capacity was more likely to be detected in association with obesity and/or hypertension compared to the normotensive or non-obese. Of interest, we found that systolic function indices such as LVEF did not show significant association with the presence of obesity or hypertension. Increased BMI showed association with structural and diastolic function indices; specifically, obese individuals were more likely to have diastolic dysfunction as indicated by lower Ea and larger LV mass when compared to normotensive, non-obese, or hypertensive-only patients. With the additional risk of hypertension, obese hypertensive patients were at further increased risk for lower Ea and E/A ratio, increased E/Ea ratio, delayed DT, as well as larger LV mass and LV mass index compared to normal controls or those with only obesity or hypertension.
Our findings are consistent with those of a previous study, in which structural and functional changes occurred with obesity, with the change of diastolic function becoming apparent before the development of systolic dysfunction with an increase of weight independent of other risk factors, such as hypertension, diabetes mellitus, age, and gender. Overweight and obese persons had 2.13 times and 3.1 times higher risk, respectively, of LV diastolic dysfunction compared to normal controls. Such changes in diastolic function associated with obesity in the absence of systolic dysfunction is in keeping with the finding that diastolic function worsened before the development of systolic dysfunction.17)
Such diastolic dysfunction was documented as one of the correlates, including advanced age, obesity, or hypertension or comorbid medical conditions that reduced exercise capacity.24)25)26) Hypertension, diabetes, and obesity which cause cardiac diastolic dysfunction, may also be an important determinant of reduced exercise capacity in patients with various cardiac diseases.24)26) In one study, LV diastolic dysfunction was reported to be an independent correlate of exercise intolerance, which was preventable through modification of diastolic dysfunction, while LV systolic function was not a determinant of a reduction in exercise capacity as indicated by a decrease in METs.25) Exercise capacity was also improved by a weight reduction program with exercise and calorie restriction, while its improvement was independent of diastolic dysfunction, which could reduce exercise capacity in metabolic syndrome.24)
In contrast to findings from previous studies, we found that among obese persons, after controlling for age and sex, those having delayed DT showed longer exercise time and those with lower LVEF and delayed DT showed greater exercise capacity as measured by METs. However, consistent with evidence supporting the relationship between diastolic dysfunction and exercise intolerance,25) obese hypertensive persons with increased E/A ratio showed greater METs.
A potential reason for the inconsistent results assessing the relationship between diastolic dysfunction and exercise capacity may be that 63.9% of subjects in the present study had diastolic dysfunction, with obese or obese and hypertensive persons showing more substantial diastolic dysfunction. However, only three subjects met criteria for abnormal systolic function in the present study with ejection fraction<50%. Our finding was consistent with a previous study finding that variations in systolic function among subjects who had ejection fraction of 50% or higher was not significantly correlated with exercise intolerance.25) Among patients who underwent echocardiography for evaluation of exercise-induced ischemia, diastolic dysfunction but not systolic dysfunction significantly affected exercise intolerance in METs independent of other correlates such as age, female sex, and BMI greater than 30 kg/m2.25) In another study, an exercise and caloric restriction intervention for 10% weight loss showed favorable effects on metabolic parameters and exercise capacity, while an increase of VO2 max was likely to occur independent of cardiac functional change in early metabolic syndrome.24)
Further analysis was performed to determine the cumulative burden of obesity and hypertension on cardiac function indices and their impact on exercise capacity. Compared to a reference group of normal, obese, and hypertensive individuals, obese hypertensive persons had poorer values in markers of cardiac function, including E velocity, E/A ratio, LV mass, and LV mass index. None of the indices of exercise capacity differed between the obese hypertensive and their counter parts. Both obesity and hypertension increased LV stroke work by disparate hemodynamic mechanisms; their presence in the same patient was likely to increase the burden on the heart and the risk for the development of advanced heart disease.16) A previous study also supported that both risks may intensify cardiac dysfunction with larger LV mass index being more likely to occur in obese persons, particularly in those also having hypertension. In addition, exercise intolerance was more likely to occur in obese persons, resulting in reduced exercise time.19) Obesity and/or hypertension were associated with diastolic dysfunction, but such dysfunction was not likely to confer decreased exercise capacity in our cohort. Despite a minimal influence of diastolic dysfunction on exercise capacity in our study, a previous study showed that diastolic dysfunction could be modified and improved with a short-term treadmill walking program or an exercise and weight loss intervention in obese persons with metabolic syndrome.24)27)28) Diastolic function parameters showed particular improvement in association with weight reduction in persons with severe obesity.24)28)
Implications
Understanding the association between obesity and cardiac function with exercise capacity may be helpful to cardiovascular prevention and promotion. Our findings extend current knowledge of diastolic dysfunction and its association with the cumulative burden of two major cardiovascular risks -- obesity and hypertension – both of which are modifiable through therapeutic weight reduction and BP control in the context of the expanding obesity epidemic15); in turn, such risk factor control could also be helpful to prevent diastolic dysfunction and further enhance exercise capacity and, therefore, help prevent or delay advanced CVDs.
Limitations
There were several limitations to this study. Firstly, the retrospective study design prevented the investigators from manipulating or controlling for variables of interest and the available data may be of poorer quality. Important data may not be available.29) For example, in the hypertensive or obese hypertensive group, medication responsiveness, which was not included in this retrospective study, was not obtained, which could affect cardiac functional alterations or exercise capacity. When data was recorded in the past, data on potential confounding factors were also often unavailable.29) Thus, more empirical evidence that corresponds with and validates the present study findings may help guide future efforts to establish cause and effect.29) Secondly, observer variability in echocardiographic measurements may also arise and would require further investigation to validate their reproducibility within acceptable ranges. Lastly, patients who participated in this study were recruited from a single university-affiliated hospital, limiting the generalizability of the results. In the present study, most of the subjects had normal LV systolic function, making the influence of diastolic dysfunction on exercise capacity less substantial. Therefore, we cannot conclusively state that poor physical performance resulted from cardiac function. Based on such empirical evidence, additional data is needed to determine whether early detection and modification of diastolic dysfunction among obese and/or hypertensive persons who are at high cardiometabolic risk is a worthwhile therapeutic goal for the promotion of cardiovascular health.
Conclusion
In conclusion, the present study found that 63.9% of persons had diastolic dysfunction. The changes were associated with obesity and/or hypertension, with obese hypertensive persons experiencing worsened diastolic dysfunction indices as compared to those who were normotensive, obese, and/or hypertensive only with minimal changes in systolic function. Notably, such dysfunction was not likely to confer decreased exercise capacity in this sample. The concomitant presence of obesity and high BP may cause escalation of diastolic dysfunction and exercise intolerance. Our findings suggest that cardiac dysfunction may be modifiable through weight loss and hypertension control and exercise capacity may thereby be promoted.
 XML Download