

 PDF
PDF ePub
ePub Citation
 Print
Print


Introduction
There may be differences between office blood pressure (BP) and out-of-office BP (home BP or ambulatory BP). These differences may have implications for long-term prognosis.1)2) High BP is a well-known cardiovascular disease risk factor, and sustained hypertension (HT) is related to increased cardiovascular events.3) Similarly, masked hypertension and isolated out-of-office HT, also show increased cardiovascular events compared to white coat hypertension (WCH) and normotension (NT).4)5)
WCH, often called isolated office HT, has been associated with adverse cardiovascular events and target organ damage compared to NT in some studies.6)7)8) Long-term follow-up of WCH data reveal an association with target organ damage or stroke independent of mean arterial pressure.8)9) However, other studies did not find such a relationship.4)5)
Recently, besides high BP, blood pressure variability (BPV) is being reported as another independent risk factor for cardiovascular events.9)10) BPV refers to the fluctuation of BP with time. BPV is defined as either the overall variability during a period of time, such as the standard deviation (SD), or the average of the absolute difference between serial readings, such as average real variability (ARV).9) BPV has the potential to be a strong predictor of stroke, independent of mean systolic BP.11)12)13) Increased large artery stiffness and left ventricular mass can be present in subjects with high BPV.14)15)
WCH may be a marker of a reaction to stress, such as a visit to the doctor's office that manifests with a BP surge and results in BPV.16) The purpose of this study is to evaluate the relationship between WCH and BPV. We postulate that subjects with WCH, which plays a controversial role in cardiovascular events, may have higher BPV than those with NT.
Subjects and Methods
Study population
This study was conducted using data from the Korean Ambulatory BP Monitoring (Kor-ABP) Registry. This data was compiled in a multicenter observational study involving 23 secondary and tertiary hospitals. From 2009 to 2013, 5302 subjects were enrolled in this registry. The methodology used in the registry and details regarding inclusion and exclusion criteria are published by Kang et al.17)
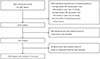
Only qualified recordings with more than 80% valid BP measurements were included in this study. After excluding outlying and missing data, the number of eligible subjects was 2367. We further excluded subjects who had a medical history of HT (n=900) and selected subjects for this study who had no known medical history of HT (n=1467). After exclusion of the subjects with a medical history of myocardial infarction and stroke, 1398 subjects remained in the final analysis (Fig. 1).
Fig. 1
Flow chart of study population. Kor-ABP: Korean ambulatory blood pressure, BP: blood pressure.
The study protocol was reviewed and approved by the institutional review board of each participating institution. Ambulatory BP monitoring (ABPM) data were collected from the patients of referral hospitals after obtaining written informed consent.
Blood pressure parameters and classification of subjects
After resting for at least 5 minutes, office BP was measured by a physician in the referral hospital outpatient clinic using a validated automated device (UA-767, A&D company, San Jose, CA, USA), with the subject in a sitting position and arm supported at heart level. The average of two measurements was used for the analysis. High office BP was defined as an average systolic BP≥140 mmHg or an average diastolic BP≥90 mmHg.
Daytime and nighttime BPs were calculated using the narrow fixed 30-minute interval method from the ABPM. However, the permissible limit of BP measuring frequency was more than every 30 minutes in the daytime and every 60 minutes in the nighttime. Variable intervals were permitted according to the referral center preferences within the limit (mean±SD, daytime: 19.87±7.0 min and nighttime: 34.16±10.5 min). The average of daytime BP values was calculated using the BP values obtained from 6 a.m. to 10 p.m., and nighttime BP values were calculated using the BP values from 10 p.m. to 6 a.m. High average daytime ambulatory BP was defined as an average daytime systolic BP≥135 mmHg or an average daytime diastolic BP≥85 mmHg. Pulse pressure was calculated by subtracting the mean diastolic BP from the mean systolic BP. All subjects were classified into four groups according to their office BP and average daytime ambulatory BP5)18): (1) NT (office BP<140/90 mmHg and average daytime ambulatory BP<135/85 mmHg), (2) WCH (high office BP and average daytime ambulatory BP<135/85 mmHg), (3) masked hypertension (MHT, office BP<140/90 mmHg and high average daytime ambulatory BP), and (4) sustained hypertension (SHT, high office BP and high average daytime ambulatory BP).
Definitions of blood pressure variability
The SD of daytime and nighttime (systolic and diastolic) BP was calculated.
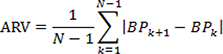
The ARV of BP was calculated using the following formula19): where N is the number of valid BP measurements and K is the order of measurements from each subject in the ABPM data corresponding to a given subject.
The coefficient of variation (CoV) was calculated from the ratio of the SD to the mean.
Statistical analyses
Baseline characteristics of subjects were compared using the chi-square test for categorical variables and one-way analysis of variance (ANOVA) test for continuous variables. Values of continuous variables were expressed as the mean±SD. A paired t-test was used to determine whether there was any difference between the SD and ARV values among groups. The significant values by one-way ANOVA BPV were entered into the general linear model to perform analysis of covariance for adjusting confounding variables, including sex, age, given medical history of diabetes mellitus, body mass index (BMI), serum creatinine, and cholesterol level. We performed post-hoc analysis with the least significant difference test. Adjusted values of continuous variables were expressed as the adjusted mean±standard error. A value of p<0.05 was considered statistically significant. Statistical analysis was performed using Statistical Package for Social Science version 19.0 (SPSS Inc., Chicago, IL, USA).
Results
Characteristics of the four groups
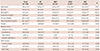
The mean age of the total 1398 subjects was 52.4±15.4 years and 47.7% were female. The average BMI of the four groups was 24.3±3.3 kg/m2. The most common group was SHT (n=658, 47.1%), followed by NT (n=364, 26.0%), WCH (n=254, 18.2%), and MHT (n=122, 8.7%). The baseline clinical characteristics of the groups are listed in Table 1. There were no significant differences in the proportion of female subjects, glucose levels, exercise, sleep quality, and medical history of diabetes mellitus between the groups. Subjects in the NT and MHT groups were older than those in the WCH and SHT groups (p=0.027). The WCH group had the smallest average abdominal circumference (85.7±10.7 cm, p<0.001). The proportion of cigarette smokers was lower in the WCH group than the other groups (p=0.005). Compared to the NT group, the other three groups had higher lower density-cholesterol levels (p<0.001).
Table 1
Baseline characteristics
Office blood pressure and ambulatory blood pressure monitoring
By definition, office BPs were higher in the WCH and SHT groups than in the NT and MHT groups. The results of ABPM were higher in the MHT and SHT groups than in the other two groups. Additionally, the difference in systolic office BP within the NT and MHT versus the WCH and SHT groups was significant (all p<0.001, Table 2). The MHT group had higher office BP values than the NT group, and the SHT group had higher office BP values than the WCH group (p<0.001). Similarly in ABPM, the difference in 24-h systolic and diastolic BP was evident within NT and WCH groups versus the MHT and SHT groups (all p<0.001).
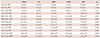
Table 2
Blood pressure values
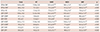
Values are presented as mean±standard deviation. *p<0.05 vs. NT, †p<0.05 vs. WCH, ‡p<0.05 vs. SHT. NT: normotension, MHT: masked hypertension, WCH: white coat hypertension, SHT: sustained hypertension, SBP: systolic blood pressure, DBP: diastolic blood pressure, HR: heart rate, ABP: 24 hour ambulatory blood pressure, DSBP: daytime SBP, DDBP: daytime DBP, DRR:daytime heart rate, NSBP: nighttime SBP, NDBP: nighttime DBP, NHR: nighttime heart rate, DPP: daytime pulse pressure
Blood pressure variability
The BPV values are presented in Table 3. With regard to daytime systolic BPV, the SD of the NT group was highest, followed by the WCH, MHT, and SHT groups, although only the NT and SHT groups showed significant differences. Contrary to SD, the daytime systolic BP ARV of the NT and SHT groups showed lower mean values compared to the other two groups. The WCH group had the highest value. A similar pattern was present in the daytime diastolic BPV. Even though there was no significant difference in the SD of daytime diastolic BP, the means of the ARV were highest in the WCH group, followed by the SHT, MHT, and NT groups (Table 3 and Fig. 2). There was no significant difference between the SD and ARV values in the NT and MHT groups (Fig. 2A and 2B). However, the SHT and WCH groups had a significantly higher ARV than SD (p<0.001); this difference was highest in the WCH group (Fig. 2A and 2B). After adjusting for the covariates of sex, age, diabetes mellitus, BMI, serum creatinine, and cholesterol level, ARV means still showed significant differences between groups (Table 4). Additionally, the ARV values of 24-h systolic and diastolic BP showed similar patterns (Fig. 3); the highest values were in the WCH group, followed by the SHT, MHT, and NT groups. However, the SD lost significance after adjusting for covariates, with only nighttime diastolic BPV between the WCH and SHT groups showing a statistically significant difference (7.9±0.4 vs. 8.7±0.3, p=0.002, Table 4). Daytime CoV was higher in the NT and WCH groups than the MHT and SHT groups (Tables 3 and 4).
Table 3
Blood pressure variability
Values are presented as mean±standard deviation. *p<0.05 vs. NT, †p<0.05 vs. WCH. NT: normotension, MHT: masked hypertension, WCH: white coat hypertension, SHT: sustained hypertension, SD: standard deviation, SBP: systolic blood pressure, DBP: diastolic blood pressure, ARV: average real variability, CoV: coefficient of variation
Fig. 2
The differences between SD and ARV within groups. The WCH group showed a large difference in the SD and ARV, which was followed by SHT. The NT and MHT groups did not show differences in daytime systolic BPV (A) or daytime diastolic BPV (B). *p<0.001. SD: standard deviation, ARV: average real variability, WCH: white coat hypertension, SHT: sustained hypertension, NT: normotension, MHT: masked hypertension, BPV: blood pressure variability, NS: non-significant.
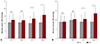
Table 4
Values of adjusted blood pressure variability
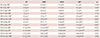
Values are presented as adjusted mean±standard error. Values are adjusted for sex, age, given medical history of diabetes mellitus, body mass index, serum creatinine, and cholesterol level. *p<0.05 vs. NT, †p<0.05 vs. WCH. NT: normotension, MHT: masked hypertension, WCH: white coat hypertension, SHT: sustained hypertension, SD: standard deviation, SBP: systolic blood pressure, DBP: diastolic blood pressure, ARV: average real variability, CoV: coefficient of variation
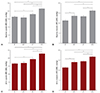
Fig. 3
The difference in ARV between groups. The WCH group shows the highest value of ARV compared to the other three groups. ARV values represent means adjusted for sex, age, diabetes mellitus, body mass index, serum creatinine, and cholesterol level. (A) Daytime SBP ARV, (B) daytime DBP ARV, (C) 24-hour SBP ARV, (D) 24-hour DBP ARV. *p<0.001. ARV: average real variability, WCH: white coat hypertension, SBP: systolic blood pressure, DBP: diastolic blood pressure, BPV: blood pressure variability, NT: normotension, MHT: masked hypertension, SHT: sustained hypertension.
Discussion
We evaluated the relationship between WCH and BPV by using data from the Kor-ABP Registry. There are several BPV indexes. In this study, the NT and MHT groups had similar BPV values, whether presented as SD or ARV. The NT and WCT groups had a lower mean 24-h BP and had a higher CoV than the SHT and MHT groups. However, both the SD and CoV have a limitation: they cannot evaluate time series variability. The ARV is more reliable than the SD due to the presence of time series variability.10)19) Our data show that the SHT and WCH groups had a higher ARV than SD. These results persisted after adjusting for confounding variables, including sex, age, medical history of diabetes mellitus, BMI, serum creatinine, and cholesterol level.
Age and sex are closely related to BPV, and antihypertensive drugs including calcium channel blockers are known to decrease BPV.9) We adjusted BPV by using confounding variables based on previous studies on BPV5)20) with the variables that showed statistical differences in the baseline characteristics. We did not consider antihypertensive medication as a confounding variable, since our study population did not include treated hypertensive patients.
WCH is the isolated office HT in untreated patients, and it is distinguished from the white coat effect based on the antihypertensive treatment.21) However, Fagard and Cornelissen.4) mentioned that most of the studies about WCH with CV outcomes include patients undergoing antihypertensive treatment, which is a study limitation. In the baseline characteristics of this study, the WCH group had a younger mean age than the NT and MHT groups, a smaller abdominal circumference and body mass index, and lower cholesterol and glucose levels than the MHT group. Their office BP level was compatible with grade 1 HT, with an average BP of 148.7/91.3 mmHg. Similar to our data, previous studies also reported patients with WCH usually have an office systolic BP of 140-159 mmHg or an office diastolic BP of 90-99 mmHg.22)23) Additionally, female sex, being a nonsmoker, lower BMI, favorable lipid profile, and a smaller value of left ventricular mass (LVM) were suggested as independent predictors of WCH. Echo data was available for 639 of the 1398 subjects (data was not shown); the adjusted LVM index in the WCH group was smaller (94.6±3.3 g/m2) than the SHT group (102.9±6.6 g/m2, p=0.013) and similar to the two other groups (NT, 95.7±2.8; MHT, 94.4±3.3).
Contrary to our study, a recent report showed that short-term BPV compared to home BP was higher in the MHT and SHT groups than the WCH and NT groups.20) This study had several differences compared to our current study, including the study population, the device for measuring out-of-office BP, and the index of BPV. They investigated elderly people who were ≥73 years old, assessed BPV with SD from 18 measurements of home BP, and included about 50% of patients taking antihypertensive medication. As mentioned in our results, the average age of our study was 52.4 years, participants were not taking antihypertensive medication, and we evaluated BPV with ARV from 24-h ABPM. Hence, the different age, study population, measuring patterns, and index for BPV may have resulted in the different results.
BPV includes both short-term and long-term changes in BP, which can be measured by ABPM and visit-to-visit variability, respectively. Our data measured short-term BPV with ABPM. BPV, which represents the fluctuations in BP, depends on sympathetic vascular modulation and changes in arterial distensibility.24)25) A cohort study suggested that high BPV is associated with impaired endothelial function.26) BPV has been reported as a strong predictor of stroke, independent of mean systolic BP.11)12)13) Specific organs, in particular the vessels of the brain, are susceptible to transient elevations in BP. Therefore, stroke risk may be increased with BP surges related to WCH, compared to a normotensive control.16)27) BPV is closely associated with primary and secondary outcomes of stroke.12)13)16)19)27)28) However, fluctuations of BP in WCH are usually transient rather than persistent. The influence on adverse cardiovascular outcomes could be minimal compared to the effect of sustained high BP.16) Cardiovascular risk is known to be the highest in subjects with SHT, followed in order by MH, WCH, and NT.4)5)8) Hence, the highest ARV in the WCH group suggests one reason for cardiovascular or cerebrovascular risk in WCH, and it does not mean that WCH has the highest risk compared to the other groups. Moreover, many factors influenced WCH with BPV including age, sex, partial or true WCH, and whether the WCH was treated or untreated. Another study about long-term CV outcomes showed only a partial WCH-related increase in CV events compared to NT.6) Hence, a long-term follow up study of WCH with high BPV is needed for confirmation of the current study results.
This study had several limitations. First, it was based on data from secondary and tertiary hospitals, and did not include primary clinics. Additionally, this is a cross-sectional observational study with no follow-up data. Thus, it was difficult to establish any causal or temporal relationships. Based on previous data and this study, we suggest using ARV as one of risk factors of WCH-related long-term vascular accidents. However, long-term prospective studies are needed for confirmation. In addition, the incidence of stroke displays differences between races.29)30) All participants in the current study were Korean, and the results therefore cannot be generalized to other ethnic groups.
In conclusion, our data showed that the WCH and MHT groups had the higher ARV values, as calculated from the average absolute difference between consecutive measurements, compared to NT. However, long-term follow-up data are needed for the determination of clinical influences of WCH in stroke.
 XML Download