

 PDF
PDF ePub
ePub Citation
 Print
Print


Introduction
In heart failure with preserved ejection fraction (HFpEF), the spectrum of diastolic abnormalities is wide and easily identified on transthoracic echocardiography (TTE) at rest.1) HFpEF is also accompanied by a variety of clinical manifestations that are associated with the level of left ventricular end-diastolic pressure (LVEDP). In patients who present with overt heart failure (HF), LVEDP is increased at rest, which can be diagnosed by means of resting TTE. Unfortunately, most patients with HFpEF who present at an outpatient clinic complain of only exertional symptoms in the absence of apparent volume overload — the so-called milder or "early" phase of HFpEF.2)3)4)5) In early HFpEF, resting left ventricular (LV) filling pressure is within the normal range, as determined by catheterization (LVEDP and pulmonary capillary wedge pressure [PCWP]), by TTE (the e/e' ratio), or by the level of brain natriuretic peptide (BNP); hemodynamic derangements develop only during the stress of exercise.2) As a result, euvolemic patients with early HFpEF will not meet current diagnostic criteria and algorithms based on resting hemodynamics alone.2) According to recent studies, based on current diagnostic guidelines issued by the European Society of Cardiology (ESC), HFpEF was diagnosed in 25% to 34% of patients with early HFpEF and in 24% with non-cardiac dyspnea.2)5) Furthermore, the hitherto commonly used radiographic, laboratory, and echocardiographic variables are also useless, so diagnosing HFpEF presents a challenge. Invasive hemodynamic assessment can help resolve this dilemma, in that a PCWP>12 mmHg or an LVEDP>16 mmHg will confirm the diagnosis.3)4)5)6) Recently, the results of invasively measured PCWP were correlated with long-term prognosis.4) However, because resting LVEDP as determined invasively falls within the normal range in early HFpEF, a diagnosis based solely on the result of this test may miss patients with early HFpEF.2)3)4)5) Whether or not a diagnosis based on surrogate markers of elevated LVEDP is valid is a matter of controversy. However, recent studies have shown that the diagnosis of early HFpEF can be made only by assessing hemodynamic responses during exercise and that invasive tests to determine exercise hemodynamics are needed for this diagnosis to be made with greater accuracy.2) Thus, researchers have recently begun to take into account the necessity and significance of the invasive hemodynamic stress test to investigate the mechanisms, diagnosis, and prognosis of this disorder.2)3)4)5)
In addition, invasive testing of exercise hemodynamics allows a more objective assessment of the effect of stress or exercise on diastolic function in early HFpEF — so-called diastolic functional reserve (DFR).2)7)8) It has been proven that DFR is also reduced in patients with HFpEF who have impaired diastolic function.7)8)9) The gold standard for measuring DFR is diastolic stress echocardiography (DSE), and a modified method is known as the passive leg-raise (PLR) test using TTE.1)10)11)12) Although the diagnosis of HFpEF requires objective evidence of elevated LV filling pressure, there has hitherto been no way to assess DFR invasively and simultaneously in patients with HFpEF who are undergoing coronary angiography (CAG) or left cardiac catheterization. Thus, the DFR or PLR test should be carried out at another time or place. Moreover, little is known about invasively measured DFR and therefore about serial changes in LV pressure in response to leg-raise exercise, a marker of DFR, in patients with early HFpEF found to have normal levels of BNP.
Thus, the aims of this study were (1) to investigate invasively the serial changes in LVEDP in response to leg-raise exercise in euvolemic patients with early HF and (2) to evaluate the relationship between serial changes in invasively measured LVEDP during leg-raise and echocardiographic results or clinical characteristics.
Subjects and Methods
Study population
This prospective, single-center (Hanyang University Guri Hospital, Guri, Korea) cohort study was conducted between July 2013 and April 2015. It included 181 consecutive patients with normal LV ejection fraction (EF) (>50%) and exertional dyspnea of at least 3 months' duration who were found to have early HFpEF on invasive hemodynamic assessment. Because early HFpEF can be considered objective evidence of LV diastolic dysfunction in euvolemic patients with dyspnea that occurs only during exercise, we screened outpatients who presented with New York Heart Association (NYHA) class II or III exertional dyspnea or equivalent symptoms (chest discomfort). Also, the patients' history also had to include at least one of the following: edema, improvement of symptoms with diuretic therapy, or cardiomegaly. TTE and BNP assay were performed on the day of admission. To document LV hemodynamics on invasive testing in early HFpEF, the BNP level should be within the normal range; therefore, patients with BNP>200 pg/mL were excluded owing to evidence of apparent HF.
Because there is no model for predicting normal hemodynamics at rest and abnormal hemodynamics on exercise, we used the echocardiographic criterion of LV diastolic dysfunction to screen the study population. Based on findings that normal LV systolic and diastolic function are usually defined as EF>50%, an E/A ratio>1, and e' velocity>8 cm/s, we selected patients with EF>50% and e'<8 cm/s or an E/A ratio<1 to isolate those patients with objective evidence of LV diastolic dysfunction. Moreover, since septal e/e' ratios of either <8 or >15 are considered to indicate either normal or increased LV filling pressure, respectively, we added 8<septal e/e' ratio<15 as another inclusion criterion.
The diagnostic criteria and algorithm for early HFpEF were explained to patients who were scheduled to undergo CAG to assess their exertional symptoms. Informed consent was obtained from each patient prior to left cardiac catheterization and the leg-raise test. Initially, we recruited 350 patients who had EF>50% and 8<septal e/e' ratio<15, an E/A ratio<1, or an e' value<8 cm/s based on resting TTE. Eight patients withdrew consent before undergoing CAG; thus, CAG was performed in 342 patients. Because 112 patients were found to have coronary artery stenosis>50% on CAG, the remaining 230 patients underwent left cardiac catheterization with leg-raise exercise. Twenty patients were unable to successfully complete the active leg-raise (ALR) exercise for 3 minutes, and 3 patients had LVEDP<16 mmHg. TTE using leg-raise was performed within 24 hours to compare the invasively measured LVEDP with the e/e' ratio, and 26 more patients were excluded from the study cohort. Eventually, 181 patients with exertional dyspnea or equivalent symptoms were included in the final analysis.
To enhance the homogeneity of the study population, patients were excluded if they had a history of coronary revascularization, previous cardiac surgery, myocardial infarction, end-stage renal disease, chronic liver disease, or cancer or if they had evidence of chronic obstructive pulmonary disease, frequent atrial or ventricular arrhythmias (ectopic focus>6 beats/minutes or atrial fibrillation), or chronic kidney disease. Also, patients with moderate to severe valve disease, cardiomyopathy, pericardial disease, intracardiac shunt, pulmonary arterial hypertension, or reduced EF (EF<50%) on TTE were excluded, as were patients who had a poor echo window or in whom measurement of LVEDP proved problematic. This study was approved by the Ethics Committee of the institutional review board at Hanyang University Guri Hospital.
Definition of hypertension, diabetes, and dyslipidemia
Hypertension was diagnosed if the office blood pressure (BP) measurement was ≥140/≥90 mmHg or if the patient was on chronic antihypertensive medication. On the basis of American Diabetes Association criteria, diabetes mellitus (DM) was defined as a fasting plasma glucose≥126 mg/dL, a glycated hemoglobin≥6.5% or on antidiabetic medication.13) According to the 2004 update of the National Cholesterol Education Program guidelines, dyslipidemia was present if low-density lipoprotein cholesterol was ≥160 mg/dL, high-density lipoprotein cholesterol was ≤40 mg/dL, triglycerides were ≥150 mg/dL, or the subject was on chronic lipid-lowering medication.14) Subjects who had smoked at least 400 cigarettes during their lifetime were classified as ex-smokers or as current smokers on the basis of current smoking status. Subjects who had had at least one drink during their lifetime were categorized as ex-drinkers or as current drinkers on the basis of current alcohol intake.
Study protocol
Cardiac catheterization and exercise protocol
Standard CAG and left cardiac catheterization was performed through a 4-6 F sheath placed in the radial or femoral artery. A 4-F pigtail catheter was introduced into the LV to assess LV hemodynamics. Baseline pre-aLV diastolic pressure (pre-aLVDP) and LVEDP at rest were measured during steady states.
Leg-raise protocol
After resting hemodynamics has been assessed, the leg-raise exercise was performed in the supine position in two stages during LV catheterization with hemodynamic monitoring: PLR, during which the leg was passively placed on a 30-cm-high pillow for 3 minutes, and then (1 minute after PLR) ALR, during which the patient independently maintained the raised leg at a height of 20 cm for 3 minutes.
Transthoracic echocardiography image acquisition and analysis
Resting transthoracic echocardiography
Before CAG and cardiac catheterization, a standard TTE exam was performed with the use of a Philips iE33 ultrasound system with S5-1 transducer (Philips Medical Systems, Andover, MA, USA). LV end-diastolic volume, LV end-systolic volume, and EF were assessed using the modified biplane Simpson's method. Left atrial volume was measured by means of the biapical area-length method. Transmitral velocities were measured on the apical four-chamber view. Peak velocity for early filling (E), atrial contraction (A), and deceleration time for the E wave were also measured. Tissue Doppler imaging was performed, and peak systolic (s'), early (e'), and late (a') velocities were measured for each annular side.
Serial e/e' ratio measurement during leg-raise test
Baseline measurements were obtained with the patient in the supine position after equilibration with the feet elevated on the 30-cm-high pillow. Transmitral E wave and tissue Doppler septal annular velocity (e') were measured. After baseline images had been obtained, PLR was performed. At 1-minute intervals, echocardiographic measurements were repeated during the leg-raises. PLR and ALR were each maintained for 3 minutes.
Definition of heart failure with preserved ejection fraction on invasive left ventricular end-diastolic pressure measurement
Measurement of left ventricular hemodynamic parameters
LV hemodynamic function was assessed using heart rate (HR), LV systolic BP (LVSBP), LV diastolic BP (LVDBP), LVEDP, and rate of LV pressure change (dP/dt). As shown in Fig. 1, the pre-aLVDP was measured at the onset of the a-wave, and the measurement of LVEDP was made at the nadir of the atrial contraction wave before the onset of the rapid rise in LV systolic pressure by automatic mechanical measurement, as described elsewhere.15) The invasively measured LVEDP and pre-aLVDP were determined at baseline, at 30-second intervals during the leg-raise test, and until 3 minutes after recovery. Because intrathoracic pressure swings are enhanced by the increased work of breathing during ALR, the individual LV hemodynamic parameters were separated into minimum, maximum, and frequent to adjust for the variability. Of 10 consecutive LVEDPs of good quality, the lowest value of LVEDP was defined as LVEDP minimum and the highest value as LVEDP maximum. Among the remaining eight LVEDP values, the most frequent value was defined as LVEDP frequent. Like LVEDP, other LV hemodynamic parameters were defined using the same system and format. Table 1 presents the abbreviations and definitions of each of the hemodynamic parameters assessed.
Intraobserver and interobserver variability
LV hemodynamic parameters were independently measured by two investigators. At first, to adjust for intraobserver and interobserver variability in the LVEDP parameters and e/e' ratios reported, measurements of reliability and agreement were performed in a subsample of 30 patients. The intraclass correlation coefficient (ICC) for intraobserver variability for the three types of LVEDP (minimum, maximum, and frequent) were 0.94, 0.94, and 0.96, respectively, at rest and 0.91, 0.94, and 0.94, respectively, during the leg-raise test. Similarly, the ICC for interobserver variability ranged from 0.92 to 0.94 at rest and from 0.91 to 0.93 during leg-raise. As with the LVEDP parameters, the ICC for intraobserver and interobserver variability for the e/e' ratio ranged from 0.81 to 0.90, which was relatively excellent. Next, a correlation analysis of LVEDP was carried out to determine the representative value among the three types of LVEDP parameters. Because the highest values of the correlation coefficients were associated with LVEDP frequent, this parameter was considered the representative value of LVEDP in the subsequent analysis.
Statistical analysis
Continuous variables are expressed as means±standard deviation, and categorical variables are expressed as percentages or frequency. Between-group comparisons of clinical characteristics, echocardiographic results, and LV hemodynamic data at rest and during leg-raise according to the change in LVEDP during leg-raise exercise were performed using the independent samples t-test for continuous variables and the χ2 test or Fisher's exact test for categorical variables. Within-group comparisons of LV hemodynamic parameters during leg-raise were performed using a repeated measures analysis of variance (ANOVA). When the difference was significant, intergroup comparisons were performed using Tukey's multiple comparison test. LV hemodynamic and echocardiographic variables obtained at rest or during leg raise were compared with the paired sample t-test or repeated measures ANOVA.
Multivariate logistic regression analysis was performed to identify independent predictors for the LVEDP response during ALR. To examine possible confounding-adjusted correlations between echocardiographic measurements and the LVEDP response to ALR, we entered age, sex, and other clinically important variables in a multivariate logistic regression analysis as independent variables. We controlled for collinearity by checking whether the standard error increased greatly or whether the adjusted R2 decreased when the new variables were included. P values less than 0.05 were considered statistically significant. All analyses were performed using the Statistical Package for Social Sciences (SPSS), version 18.0 (SPSS Inc., Chicago, IL, USA).
Results
Clinical and echocardiographic characteristics
Clinical and echocardiographic parameters are shown in Supplementary Table in the online-only Data Supplement. Of the total 181 patients, 87 (48.06%) were male, 88 (48.61%) had hypertension, and 36 (19.89%) had DM. The mean age was 58.02±12.84 years (median: 55) and mean body mass index was 25.09±5.67 kg/m2. Fifty-six (30.94%) patients reported NYHA II dyspnea, 112 (61.88%) had NYHA III dyspnea, and 13 (7.18%) presented with chest discomfort on exertion. Both exertional dyspnea and chest discomfort were present in 23 patients (12.71%). Sixty (33.15%) patients complained of edema, and 126 patients (69.61%) were being treated with various types of diuretics. Cardiomegaly was observed on chest X-ray in 115 patients (63.53%). The mean serum BNP level was 48.42±80.42 pg/mL, mean estimated glomerular filtration rate was 96.54±19.01 mL/minute, and mean total cholesterol was 171.79±41.30 mg/dL. Mean systolic BP was 135.66±24.33 mmHg, mean diastolic BP was 74.67±17.78 mmHg, and mean HR was 74.21±12.75 beats/minute. The mean E/A ratio was 0.83±0.32, and the mean septal e/e' ratio was 10.03±2.53.
Time course of invasively measured left ventricular end-diastolic pressure and septal e/e' ratio during leg-raise
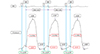
As shown in Fig. 2 and Supplement Fig. 1 in the online-only Data Supplement, leg-raise exercise significantly increased all three LVEDP parameters (minimum, maximum, and frequent), as compared with those during the initial resting state (p<0.05). When LVEDP was elevated by ALR, most patients complained of dyspnea or chest discomfort, which usually developed on daily exercise and activity. During recovery, LVEDP returned almost to baseline levels within 3 minutes in the order of minimum, frequent, and maximum. Unlike the invasively measured LVEDP, the septal e/e' ratio during PLR and ALR showed no significant changes (Fig. 2).
Leg-raise exercise also affected the LV hemodynamic parameters. Various types of LVSBP, LVDBP, and pre-aLVDP were significantly increased. Also, HR and dP/dt values were elevated at the end of ALR (p<0.05) (Table 2); in particular, as compared with values obtained during the initial resting state, ALR caused significant changes in these LV hemodynamic parameters, whereas no significant changes were observed during PLR.
Serial changes in invasively measured left ventricular end-diastolic pressure during leg-raise exercise
Although leg-raise exercise, especially ALR, caused significant increases in all three types of LVEDP in the total study cohort, a decrease in the value of LVEDP frequent was observed in 40 patients (22.1%) at the end of ALR, as compared with this value at the start of ALR. The severity of symptoms correlated with the level and the extent of change in LVEDP (ΔLVEDP). Patients with decreased LVEDP complained of symptoms that were more severe during early exercise, when the LVEDP was usually elevated, whereas in patients with increased LVEDP, the intensity of the symptoms was proportional to the duration of exercise, and symptoms that were more severe occurred during late exercise. Based on the ΔLVEDP associated with symptoms, the total population was divided into two groups: patients were assigned to the ΔLVEDP≤0 mmHg group if LVEDP at the end of ALR was lower than that at the start of ALR; the remaining patients were assigned to the ΔLVEDP>0 mmHg group.
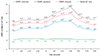
As shown in Fig. 3, the mean value of LVEDP frequent at the end of ALR was 24.90±2.50 mmHg in the total population, 27.90±2.92 mmHg in the ΔLVEDP>0 mmHg group, and 14.30±2.18 mmHg in the ΔLVEDP≤0 mmHg group (p<0.01). Although the difference was not significant, LVEDP levels in the ΔLVEDP≤0 mmHg group remained lower throughout PLR than did those in the ΔLVEDP>0 mmHg group. Irrespective of the initial LVEDP level or response to ALR, however, all types of LVEDP were more significantly increased at the end of PLR when compared with the initial LVEDP (p<0.05) (Fig. 3).
In contrast to PLR, the LVEDP responses to ALR were clearly discriminated between the two groups. The LVEDP in the ΔLVEDP>0 mmHg group was increased steadily and significantly during the first 60 seconds of ALR and remained constantly elevated until the end of ALR. The LVEDP in the ΔLVEDP≤0 mmHg group was slightly elevated during early ALR. But declined significantly declined after 90 seconds of ALR and progressively decreased until the end of ALR. The patterns of recovery also differed considerably. The LVEDP in the ΔLVEDP≤0 mmHg group returned to the initial value of ALR within 60 seconds after ALR was terminated, whereas in the ΔLVEDP>0 mmHg group the rate of recovery of LVEDP was slower and was restored to normal values within 180 seconds after ALR was over (Fig. 3).
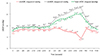
Septal e/e' ratios in the ΔLVEDP≤0 mmHg group were significantly lower at the start (initial rest), on PLR, and on ALR, as compared with those in the ΔLVEDP>0 mmHg group. However, septal e/e' ratios were not significantly changed throughout PLR and ALR. During recovery, the e/e' ratios were restored to their initial levels within 3 minutes, and the differences were sustained constantly and significantly between the two groups (Fig. 4).
Comparison of clinical characteristics according to the pattern of left ventricular end-diastolic pressure response to leg-raise
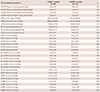
During PLR, LVEDP in the ΔLVEDP≤0 mmHg group was elevated by a mean of 1.00±2.28 mmHg and increased by 1.50±2.36 mmHg in the ΔLVEDP>0 mmHg group. During ALR, LVEDP in the ΔLVEDP≤0 mmHg group decreased by a mean of -4.10±3.21 mmHg and increased by a mean of 7.89±5.24 mmHg in the ΔLVEDP>0 mmHg group (p<0.001) (Table 3). Thus, LVEDP in the ΔLVEDP≤0 mmHg group decreased by a mean of -2.90±4.07 mmHg, whereas LVEDP in the ΔLVEDP>0 mmHg group was elevated by a mean of 9.68±5.75 mmHg (p<0.001) (Table 3). Although the extent of change during ALR was similar in the two groups, the dP/dt value in the ΔLVEDP≤0 mmHg group was higher during the initial stage and at the end of ALR (p<0.05) (Table 3 and Supplement Fig. 2 in the online-only Data Supplement). The ΔLVEDP≤0 mmHg group had a higher HR during the initial stage and during leg-raise, although the difference was not significant (Table 3 and Supplement Fig. 3 in the online-only Data Supplement). At the initial stage, the LVEDP variables showed no difference between the two groups, whereas the values for all the types of LVEDP variables during ALR were significantly lower in the ΔLVEDP≤0 mmHg group (p<0.001) (Table 3). Pre-aLVDP parameters showed no difference between the two groups during the initial stage but were lower at the end of ALR in the ΔLVEDP≤0 mmHg group (p<0.001) (Table 3). Various types of LVDBP and LVSBP parameters showed no significant differences between the two groups (Table 3).
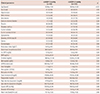
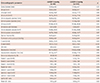
The most significant difference was that the mean age of the ΔLVEDP≤0 mmHg group was lower than that of the ΔLVEDP>0 mmHg group (p<0.01) (Table 4). Except for age, no other clinical and laboratory parameters differed significantly between the two groups (Table 4). Among the TTE parameters, the E and A waves were lower in the ΔLVEDP≥0 mmHg group, but the E/A ratio was similar in the two groups. Unlike the E/A ratio, the septal e/e' ratio, lateral e/e' ratio, and mean e/e' ratio were all significantly lower in the ΔLVEDP≤0 mmHg group (p<0.05) (Table 5).
Model for predicting the pattern of left ventricular end-diastolic pressure response during active leg-raise
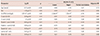
On univariate analysis, we found that age, sex, dP/dt, A wave, septal e' wave, septal e/e' ratio, lateral e/e' ratio, and mean e/e' ratio were all significantly associated with the pattern of LVEDP response during ALR (p<0.05) (Table 6). On multivariate analysis to predict the changes in LVEDP during ALR, both age and septal e/e' ratio remained significant predictors (p<0.01) (Table 7).
Discussion
This study demonstrated the serial changes of LV hemodynamics during leg-raise exercise in patients with early HFpEF who underwent left cardiac catheterization. This helps us to understand how LV hemodynamics respond to exercise in euvolemic patients with exertional dyspnea or dyspnea-equivalent symptoms. The increase in LVEDP seen only during exercise in the patients with exertional dyspnea and normal BNP is in agreement with the results of previous studies.2)3)4)5)8) First of all, the stress test for diastolic functional assessment has hitherto not been feasible in patients undergoing CAG or cardiac catheterization. Our study showed that the measurement of LVEDP during leg-raise exercise may be considered as a simple option to assess diastolic function or to document whether exertional symptoms are associated with early HFpEF in patients with nonsignificant coronary stenosis.
The most novel finding in this study is the two distinct patterns of LVEDP changes observed during ALR in patients with early HFpEF. Elevated LV filling pressure and impaired DFR have been identified in HFpEF during exercise.1)2)8) As expected, LVEDP increased steadily in most of the patients (77.9%) throughout ALR. In contrast, LVEDP increased moderately during the early stage of ALR and then declined during the late stage in 22.1% patients. Biphasic changes in LVEDP seen during exercise were previously reported in nonobstructive hypertrophic cardiomyopathy (HCM).16) Severe HCM had caused a steady increase in LVEDP throughout exercise, whereas mild to moderate HCM led to biphasic changes in LVEDP.16) In a similar context, the severity of LV hypertrophy (LVH) was reported to determine the hemodynamic responses to exercise and also to be inversely associated with LV functional reserve during exercise.16)17) However, patients with HCM were excluded from our study population. In addition, in our study, LVH or an LV mass caused no difference between the ΔLVEDP≤0 mmHg and ΔLVEDP>0 mmHg groups, which suggests that the LVEDP response to ALR was not determined by the severity of LVH. On the contrary, our study showed that the LVEDP response to ALR was significantly associated with the e/e' ratios rather than with LVH or an LV mass. This finding highlights the fact that the change in LVEDP in response to ALR depends mainly on LV hemodynamics rather than on LV geometry.
Biphasic changes of LVEDP in HCM were related to improved coronary microcirculation in response to beta-adrenergic stimulation and metabolic vasodilation induced by beta-adrenergic activation.16) Likewise, in our study, the two distinct responses of LVEDP to the ALR test might be ascribed to the individual person's diastolic capacity and to different responses to beta-adrenergic stimulation. The finding that patients with ΔLVEDP≤0 mmHg were younger and had a lower e/e' ratio at rest contains the key to solving this puzzle. Although age may be an unmeasured confounder, most abnormalities seen in patients with HFpEF are also noted with normal aging. As the enhancements in HR, contractility, and peripheral vasodilation become impaired with aging, HFpEF is inevitably more dependent on diastolic reserve during exercise.8) Enhanced diastolic LV filling is normally achieved through contraction to lower end-systolic volumes and enhance relaxation. However, increased LV chamber stiffness and inadequate enhancement of relaxation are the key mechanisms in HFpEF.4) In the absence of volume overload, LVEDP is determined by LV relaxation and myocardial stiffness, which is regulated by the extracellular matrix (collagen deposition) and intrinsic cardiomyocyte stiffness.7) Thus, essential components in decreasing LVEDP are the improvement in LV relaxation and reduction in myocardial stiffness. Normally, isovolumic relaxation rates increase with supine exercise, and the LV can fill to greater preload volumes during a shorter interval.8) This highlights that enhanced diastolic LV filling is not achieved only by leg-raise, age, or e/e' ratio. Conversely, despite impaired LV relaxation or myocardial stiffness, it inherently has a potential to compensate for the increased LVEDP during early ALR. In other words, the patients with a decreased LVEDP response might have a relatively compliant LV with preserved relaxation but will never have normal LV function — the so-called earlier stage of HFpEF — whereas those with increased LVEDP are likely to have a stiffer LV with more impaired relaxation and decreased compliance.
Another interesting finding was that, although LVEDP in the ΔLVEDP≤0 mmHg group was elevated by a mean of 1.0±2.28 mmHg at the end of PLR (ΔLVEDP>0 mmHg group; 1.50±2.36 mmHg), the extent of increase in LVEDP during PLR — suggesting the effect of preload on LVEDP — was not associated with the extent of decrease in LVEDP during ALR. Thus, a decreased LVEDP in response to ALR must be attributed to preload-independent factors. In previous studies, sympathetic tone determined the DFR during exercise.1) In our study, ALR significantly increased HR and LVSBP, whereas no significant changes were observed in HR and BP during PLR. This finding indicates that sympathetic activity may be the main effector of the LVEDP response to ALR. Similarly, biphasic LVEDP changes in HCM disappeared after the administration of propranolol.16) During exercise, diastolic LV filling is augmented through increased elastic recoil and enhanced LV relaxation related to beta-adrenergic stimulation (which promote augmented diastolic "suction").8)18) However, because enhancement of a diastolic relaxation response to exercise-induced adrenergic stimulation was blunted in the patients with HFpEF, the insufficient ventriculoatrial suction occurred during early diastole and eventually led to an increase in LVEDP.8)18) Taken together, a decreased LVEDP in response to ALR may be due to the less blunted enhancement of the diastolic relaxation response to exercise-induced adrenergic stimulation, which also indicates an earlier stage of HFpEF.
Just as HFpEF is reflected in a wide spectrum of diastolic abnormalities, so may there be various stages in the response to therapy in patients with early HFpEF. Interestingly, the severity of dyspnea correlated with the LVEDP level and extent of its change (ΔLVEDP). Patients with ΔLVEDP≤0 mmHg complained of more severe dyspnea during early exercise. The LVEDP in those patients declined after the early stage of exercise, which coincided with the change in the intensity of symptoms. This underlines the notion that maintaining steady and regular exercise at a constant strength level may decrease LVEDP and thus have a role in the treatment of HFpEF. In reality, there is no proven pharmacotherapy to improve survival in patients with HFpEF, and exercise training is the best option for improving LV diastolic function, exercise capacity, and quality of life.3)19)20) In contrast, based on our result that the leg-raise exercise accelerated an increase in LVEDP in patients with ΔLVEDP>0 mmHg, the benefit of exercise may at most be smaller in this group. That is, early HFpEF may be at a reversible stage where exercise decreases LVEDP and therapy induces a good response.
Another novel finding of our study is that the serial changes of the invasively measured LVEDP to the leg-raise exercise were inconsistent with the changes in the septal e/e' ratio. This mismatch was previously reported in the RALI-DHF (RAnoLazIne for the Treatment of Diastolic Heart Failure) study.20) Until now, the e/e' ratio has been thought to reflect LV filling pressure, and serial changes in the e/e' ratio have been recognized as evidence in determining the diagnosis in patients with diastolic dysfunction.2)7) In this study, sequential LVEDP responses to the leg-raise test changed significantly in patients with early HFpEF, whereas no significant changes were observed in the e/e' ratio. This underlines the fact that the e/e' ratio does not reflect an immediate change in LVEDP; however, it does not mean that the e/e' ratio is not associated with LVEDP. First of all, the patients who showed serial changes in the e/e' ratio on the DSE had undergone overt decompensation and hospitalization, whereas our study group consisted of patients with early HFpEF who had never been admitted to the hospital with overt HF. Second, the invasively measured LVEDP and serial e/e' ratio measurements during leg-raising were not obtained simultaneously, and this time lag might have caused a mismatch between data.
Finally, our study should be interpreted within the context of its limitations. First of all, in addition to the patients who had effort dyspnea, those with chest discomfort on exertion were initially screened and recruited for the study, which might be considered a limitation. However, in outpatient practice, exertional chest discomfort often cannot be clearly distinguished from exertional dyspnea. Even though both symptoms are sometimes combined, they may be ignored or missed owing to indifference on the part of the examiner or to a preconception taken for granted. Moreover, because there is no proven therapy, the benefit of the patient must be considered first and foremost when one is considering invasive procedures to assess hemodynamic diastolic function or to diagnose early HF. In terms of diagnostic, interventional, practical, and economic efficacy, the invasive procedure to determine and document the causes of symptoms must be the most reasonable practice when scheduling patients for CAG if they are found to have nonsignificant coronary artery stenosis. In other words, because the heterogeneous population was a natural result and reflects actual practice to the utmost, it may be considered an advantage and benefit rather than a limitation. In fact, the leg-raise exercise is directly and easily applicable to real practice and obviates the expense of additional time, place, or device. Thus, the focus of our study was not to adhere strictly to the condition of whether chest discomfort on exertion is a diagnostic criterion of HFpEF, but rather to detect elevated LVEDP in patients with chest discomfort on exertion, corresponding to early HFpEF.
Second, we enrolled only those patients with a BNP level below 200 pg/mL. These low levels may be controversial, although BNP<200 pg/mL was actually an inclusion criterion for invasive hemodynamic stress testing in a previous study.2) As BNP>200 pg/mL is the recommended ESC cutoff for the diagnosis of HFpEF,6) patients who present with symptoms of HF and a BNP>200 pg/mL can be clinically diagnosed as having HF, and thus invasive stress testing may add negligible additional benefits. Moreover, previous studies have shown that BNP has a limited role in early HFpEF.2)5)21) Despite severe subjective and objective exercise intolerance in patients with clinically diagnosed HFpEF, average N-terminal proBNP levels were found to be similar to those in healthy controls.21) The noninvasive markers of congestion fall within the normal range if filling pressures are only intermittently elevated, such as during exercise.2)
Third, because our results were analyzed as a cross-sectional study, the effect of leg-raise exercise on LV hemodynamics or DFR was not sufficient to establish a cause–effect relation or underlying mechanisms. In addition, we could not demonstrate how the LVEDP response to ALR was associated with clinical outcomes. Our findings should be recognized as hypothesis-generating and as requiring further confirmative studies.
In conclusion, on the basis of LVEDP change (ΔLVEDP) as a marker of DFR, biphasic changes in LVEDP in response to the ALR test is a useful criterion of functional reserve to stratify patients with early HFpEF. Despite a similar LVEDP at rest, the various spectra of LV hemodynamic responses to exercise and clinical manifestations may be observed in early HFpEF, depending on the individual's diastolic capacity. With the exception of age and septal e/e' ratio, various types of parameters at rest did not predict the LVEDP response to ALR. Thus, in early HFpEF that does not meet currently used diagnostic criteria, invasive exercise stress testing plays an important role in both the diagnosis of HFpEF and the elucidation of an individual's capacity of diastolic property. Moreover, because not all patients with HFpEF satisfy the criteria specified in the current guidelines, one should avoid diagnosing HFpEF on the basis of BNP alone or a noninvasive marker of filling pressure at rest, especially in terms of early HFpEF.2)


 XML Download