

 PDF
PDF ePub
ePub Citation
 Print
Print


Introduction
The efficacy of statins in the secondary prevention of acute myocardial infarction (MI) have been well established and statin therapy has been regarded as essential part of medical therapy in all patients with acute MI.1)2)3) The benefit of statin was demonstrated, irrespective of plasma level of low density lipoprotein cholesterol (LDL-C). The Cholesterol and Recurrent Event (CARE) trial revealed that cholesterol lowering with statin improved clinical outcome in patients with coronary artery disease who have average cholesterol level.4) Another study reported that statin therapy is also beneficial, even in acute coronary syndrome patients with extremely low baseline LDL-C level (<70 mg/dL).5)
Although the statin is a most powerful drug for lowering LDL-C, the effect of statin on increasing HDL-C and lowering triglyceride are modest or suboptimal. However, there have been few trials that evaluated the benefit of statin in acute MI patients with low HDL-C and high triglyceride. The subgroup analysis of Justification for the Use of Statin in Primary Prevention; An Intervention Trial Evaluating Rosuvastatin trial revealed that the efficacy of statin was less prominent in patients with metabolic syndrome.6) However, this trial evaluated healthy men and women with elevated C-reactive protein.
In real clinical practice, the number of MI patients with lipid profiles of dyslipidemia is substantial, especially in Asian communities.7) Therefore, it is necessary to evaluate the benefit of statin in this group of acute MI. We investigated the differential effect of statin according to the baseline level of HDL-C and triglyceride.
Subjects and Methods
Study population
This study enrolled 36580 patients, diagnosed as acute MI consecutively from November 2005 to January 2012, and analyzed retrospectively. This data was collected from the Korea Acute Myocardial Infarction Registry (KAMIR), which is a multi-centered and ongoing observational trial designed to evaluate demographic, angiographic, and clinical data about acute myocardial infarction patients. The KAMIR was supported by a research grant from the Korean Society of Cardiology and the study protocol was evaluated and approved by the ethics committee at each institution.
Among total enrolled patients, 20703 patients were diagnosed as ST-segment elevation myocardial infarction (STEMI) and 15877 patients were diagnosed as non-ST-segment elevation myocardial infarction. The diagnostic criteria for acute myocardial infarction was defined as a typical rise and fall of cardiac biomarker values and at least one of following: 1) symptoms of ischemia, 2) development of pathologic Q wave in the electrocardiogram, 3) new significant ST-segment or T wave change or new-onset left bundle branch block, or 4) identification of intracoronary lesion by angiography.8) All eligible patients were diagnosed as acute MI and >18 years of age at admission. Fasting lipid profiles were evaluated within 24 hours after admission. The patients who had been treated by statin before the episode of acute myocardial infarction were also included in this study. There was no limitation of enrollment according to the strategy of therapy. The procedure of percutaneous coronary intervention (PCI) was done according to local standard protocol. The administration of glycoprotein IIb/IIIa inhibitor and selection between unfractionated or low molecular weight heparin were left to the discretion of the individual clinician. In the case of STEMI, PCI was performed with the intention of restoring blood flow in the infarct-related coronary artery as soon as possible. The use of other medications (e.g., aspirin, clopidogrel, beta-blocker, and renin-angiotensin system blocker) was decided based on the clinical state of an individual patient.
The exclusion criteria in this study were following: 1) patients with normal coronary artery on angiography, 2) MI because of coronary artery spasm, 3) patients who died in a hospital, or 4) patients with missing records about the use of statin. After excluding these patients, 24653 patients were divided into 4 groups, according to the baseline level of HDL-C and triglyceride, and analyzed: group A (HDL-C≥40 mg/dL and triglyceride<150 mg/dL; n=11819), group B (HDL-C≥40 mg/dL and triglyceride≥150 mg/dL; n=3329), group C (HDL-C<40 mg/dL and triglyceride<150 mg/dL; n=6062), and group D (HDL-C<40 mg/dL and triglyceride≥150 mg/dL; n=3443).
Study protocols
Each of the four groups was divided into two subgroups according to the prescription of statin at discharge after an episode of acute MI. We compared the clinical outcome between a statin user and non-user in each of the 4 groups.
The primary end points were cumulative incidence of major adverse cardiac events (MACE). MACE was defined as the composite of cardiac death, recurrence of non-fatal MI, target vessel revascularization (TVR), and coronary artery bypass surgery. Cardiac death was defined as all-cause mortality without a definite non-cardiac cause and recurrent MI was defined as recurrent symptoms with a new electrocardiographic deviation or abnormal elevation of cardiac marker at least twice the upper limit of the reference range. TVR was defined as any repeated intervention in the treated vessel within and beyond the target lesion. The secondary end points were cardiac death, non-fatal MI, TVR, and target-lesion revascularization (TLR), respectively. TVR was defined as repeated intervention that is limited within the previous target lesion. Clinical follow up was performed during 2 years and the cumulative incidence of the primary and secondary endpoints was compared between the statin and non-statin group in each group A and group B.
To adjust the selection bias that inevitably occurs in the analysis of registry data, we adopted propensity score matching. We compared baseline characteristics and clinical outcome and after propensity score matching. To adjust compounding variables more accurately, we also performed multivariate analysis after propensity score matching. Additionally, the benefit of statin in groups B, C, or D was compared with the benefit in group A.
Statistical analysis
All analyses were performed using SPSS Version 21 (SPSS Inc., Chicago, IL, USA). Categorical baseline variables are presented as counts and percentages and continuous variables are expressed as mean±standard deviation. Differences in baseline characteristics were compared by the Student t-test for continuous variables and the Pearson chi-square test for categorical variables. Cumulative cardiac event-free survivals were evaluated by the Kaplan-Meier method and compared by the log-rank test between the statin user and non-user. Because the baseline characteristics were significantly different between these two groups, we performed propensity score matching.
Propensity score matching is a statistical matching technique that attempts to estimate the effect of statin therapy in this statistical analysis of observational data. Propensity scores were estimated using a non–parsimonious multivariable logistic regression model, with the dependent variable was the use of statin, and the 13 baseline characteristics were entered as covariates. Matching was performed using R-macro (1-to-1 with a replacement) and a caliper width of 0.25 of the standard deviation. In the propensity score–matched analysis, many patients remained unmatched and were thus excluded from this analysis. The comparison of baseline characteristics and survival analyses was also done after propensity matching. To evaluate the clinical benefit of statin more accurately, we used multivariate Cox regression analysis. The covariates for this analyses were age over 65 years, hypertension, diabetes mellitus, left ventricular ejection fraction, Killip classification, post-thrombolysis in myocardial infarction (TIMI) flow, and the use of aspirin, clopidogrel, beta-blocker, and renin-angiotensin system blocker. Hazard ratios (HRs) and 95% confidence intervals (CIs) were calculated and all tests were two-tailed: the p<0.05 was considered significant.
Results
Baseline characteristics
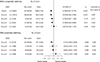
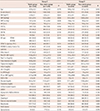
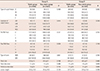
Before propensity matching, many clinical baseline characteristics were different between the statin user and non-user in each of the 4 groups. Therefore, we adjusted these differences with propensity score matching. But despite propensity matching, the rate of use of unfractionated heparin or low-molecular weight heparin was significantly different in group A and group C. The average age was different between that in user and non-user in group D. Furthermore, the systolic and diastolic blood pressures were not adjusted appropriately in group C. However, most of other differences of the baseline clinical and procedural characteristics were adjusted appropriately after matching (Tables 1 and 2).
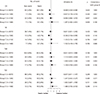
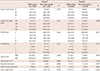
The angiographic and procedural characteristics were also adjusted by propensity score matching. After adjustment, there was no significant difference between the statin and non-statin groups in groups A, B, and D. However, the pre-TIMI and post-TIMI flows were significantly different between the statin and non-statin groups in group C (Tables 3 and 4).
Clinical outcome before propensity matching
This lipid-lowering therapy with statin significantly reduces the cumulative incidence of MACE in group A (HR=0.676; 95% CI: 0.582-0.785; p<0.001) and group C (HR=0.798, 95% CI: 0.649-0.980, p=0.031). Although statistically insignificant, statin therapy had a tendency to reduce the rate of MACE in group B. However, the benefit of statin was not prominent in group D before propensity-score matching (Fig. 1). The benefit of statin in group A was significantly different from group D (interaction p=0.042) (Fig. 1).
Clinical outcome after propensity matching
In a propensity-matched population, statin therapy significantly reduces the cumulative incidence of MACE in group A (HR=0.752, CI: 0.609-0.929, p=0.008). However, this benefit of statin therapy was not prominent in groups B, C, or D (Fig. 1). In particular, the benefit of statin in group D was significantly different from group A (interaction p=0.043) (Fig. 1).
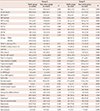
To evaluate the impact of statin therapy on clinical outcome more accurately, we performed multivariate Cox regression analysis. This analysis demonstrated that the benefit of statin therapy was significant in group A (HR=0.692, CI: 0.543-0.882, p=0.003). However, this benefit was not prominent in groups B, C, or D (Table 5).
The comparison of the incidence of a secondary end point was performed after propensity matching. Statin therapy significantly reduced cardiac death in group A (HR=0.628, CI: -0.938, p=0.023) (Fig. 2). However, the impact of statin on recurrence of non-fatal MI, TVR, or TLR was not prominent in group A. In groups B, C, or D, the benefit of statin on the secondary end point was not significant (Fig. 2).
Discussion
Our study evaluated the differential benefit of statin according to the baseline level of HDL-C and triglyceride and revealed that the impact of statin on clinical outcome was not significant in acute MI patients with lipid profiles of dyslipidemia (HDL-C<40 mg/dL and triglyceride≥150 mg/dL). On contrary, the benefit of statin was prominent in patients without lipid components of dyslipidemia (HDL-C≥40 mg/dL and triglyceride<150 mg/dL). The benefit of statin was significantly different in these two groups.
Although the current guidelines recommend that statin therapy should be initiated and continued in all acute MI patients without contraindications to its use, a trial evaluated the impact of baseline LDL-C on the efficacy of statin and reported that the benefit of high-intensity statin declines as a function of decreasing baseline LDL-C level.9)10) However, there was no large-scaled study that evaluated the impact of baseline HDL-C and triglyceride on the benefit of statin in secondary prevention of acute MI.
Although a causal relationship was not established, the level of HDL-C is inversely related to the development and prevalence of coronary heart disease.11) Moreover, two randomized-controlled trials reported that increasing HDL-C level improve the clinical cardiovascular outcome.12)13) Additionally, most patients with low HDL-C have increased blood level of triglyceride and hypertriglyceridemia also appears to increase cardiovascular risk.14) However, the impact of dyslipidemia on the benefit of statin has been sparsely investigated.
There was a slight discrepancy between the results of our study and the subgroup analysis of CARE trial. The subgroup study of CARE trial revealed that the benefit of statin was significant in MI with low HDL-C (<37 mg/dL) (HR=0.079, p=0.008). The statin therapy also revealed the tendency to reduce cardiovascular risk (HR=0.085, p=0.07) in acute MI patients with a high level of triglyceride (≥144 mg/dL), although it is not statistically significant.4) However, this study did not evaluate the benefit of statin in acute MI patients with both components of lipid profiles of metabolic syndrome. The magnitude of risk reduction was smaller in patients with low HDL-C or high triglyceride, when compared with patients with high HDL-C (≥37 mg/dL) or low triglyceride (<144 mg/dL) in the CARE trial. This trend was more prominent in our study. The cause of this discrepancy may be explained by difference in the ethnicity of the enrolled patients, as well as the diversity of types and doses of used statin.
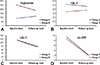
The main mechanisms, by which statin improves cardiovascular outcomes, are lowering LDL-C level and decreasing systemic inflammation.4)6) The effect of statin on increasing HDL-C and decreasing triglyceride is not substantial or optimal. This study revealed that the magnitude of reduction of LDL-C and high-sensitivity C-reactive protein were similar between group A and group D after statin therapy for 1 year (Fig. 3). This result suggested that the low density lipoprotein (LDL) lowering and anti-inflammatory effect of statin were not different according to the baseline level of HDL-cholesterol and triglyceride. However, the difference of baseline characteristics were not adjusted when we compared the LDL-lowering and anti-inflammatory effect of statin between groups A and D. This is a limitation of this study. Although there were a decrease of triglyceride and increase of HDL-C after statin therapy, the level of triglyceride and HDL-C did not achieve normal range in a group with both components of the lipid profile of the metabolic syndrome.
Therefore, a different strategy may be necessary for the secondary prevention of MI in patients with lipid components of the metabolic syndrome. The medications, which target low HDL-C and high triglyceride, were evaluated in several clinical trials. The long-term use of fenofibrate, the most potent type of fibrate, failed to reduce cardiovascular event in the Fenofibrate Intervention and Event Lowering in Diabetes trial.15) Another trial revealed that the combination of fenofibrate and simvastatin did not reduce the rate of fatal cardiovascular events, non-fatal MI or non-fatal stroke, when compared with simvastatin alone.16) Several studies revealed that a combined HDL-C-raising with nicotinic acid and LDL-C lowering with statin regimen significantly reduced the risk of a composite of death, MI, stroke, and revascularization.17)18)19) The magnitude of risk reduction with this combination therapy was greater than that typically observed in studies that evaluated statin alone. These results suggested that the combination of nicotinic acid and statin provides additional benefit beyond that attributable to simply lowering LDL-C by statin. However, because the population of these studies was relatively small, larger randomized-controlled trials are necessary to demonstrate the additive benefit of nicotinic acid on cardiovascular outcome. Another type of HDL-C-raising medication, cholesterol ester transfer protein inhibitor, is also under investigation.20)21)
Our study has several limitations. First, the reason for not using statin was omitted in this registry. The total of enrolled patients not treated by statin was 29.5% and this percentage is similar with another study.22) The second limitation is that the enrolled patients were treated by various types and dosages of statin. Therefore, we cannot evaluate the effect of a specific type or dosage of statin. Third, we did not analyze the differential benefit of other current studies. Fourth, the level of TG was not adjusted when we analyzed the change of HDL-C and TG. Moreover, because this study was retrospective, a randomized controlled study is necessary to demonstrate the differential benefit of statin more accurately, according to the levels of HDL-C and triglyceride.

 XML Download