

 PDF
PDF ePub
ePub Citation
 Print
Print


Introduction
Acute coronary syndrome (ACS) as a presentation of coronary atherosclerosis is associated with inflammatory mechanisms involved in the development of atherosclerotic plaque and subsequent rupture and thrombosis.1) Inflammation-based markers have been used to detect high-risk patients and their prognosis.2) Leukocytes have important roles in inflammatory processes.3) Increased white blood cell (WBC) count has been shown to be a predictor of clinical outcomes of patients with ACS.4) Besides leukocytes, platelets have been reported to have substantial effect on the development of cardiovascular events through inflammatory mechanisms.5) Mean platelet volume (MPV) as a marker of platelet activation is another inflammatory marker that has been demonstrated to be a prognostic marker in ACS setting.6)
Metabolic syndrome (MetS) is a combined cardiovascular risk factors phenomenon. It includes visceral obesity, dysglycemia, hypertension, elevated triglycerides, and decreased high density lipoprotein.7) MetS has become a serious public health problem due to increases in its prevalence and risk of developing type 2 diabetes mellitus and cardiovascular atherosclerotic diseases.8) However, the main mechanism involved in how MetS increases these risks remains to be elucidated.8) In terms of the pathophysiology of MetS, inflammation has been reported to be a main factor that leads to the development of MetS and cardiovascular diseases.9) Some studies have recently found a relationship between the presence of MetS and elevated WBC count, C-reactive protein, fibrinogen, and interleukin.9) Taking into account of the aforementioned evidences, we evaluated the prognostic value of a novel inflammation-based marker named white blood cell count to mean platelet volume ratio (WMR) in non-ST elevation acute coronary syndrome (NSTE-ACS) patients with or without MetS.
Subjects and Methods
Study design
This study was conducted in a prospective fashion. The study protocol was approved by both local ethics committee of Urmia University of Medical Sciences (UMSU) and our Institutional Review Board in the Seyyed-al-Shohada Heart Center of UMSU, Urmia, West-Azerbaijan province, Iran. Consent forms were obtained from all participants. The prognostic value of complete blood count components in patients diagnosed with ACS was evaluated. A total of 862 consecutive patients admitted to emergency department with a chief complaint of new onset chest discomfort were assessed from August 2012 to March 2013. Patients with ST elevation myocardial infarction (STE-MI), non-ACS chest pain, and cases whose data were incomplete for identifying MetS, or follow-up were not available were excluded from this study. Other exclusion criteria included cancer history, inflammatory diseases, autoimmune diseases, infectious diseases, and immunosuppressed. After using the exclusion criteria, a total of 331 NSTE-ACS patients with complete information were enrolled.
Patient selection and data collection
Patients with new onset chest discomfort were subjected to full examination, cardiac markers (creatine kinase MB isoenzyme and troponin I), and a standard 12-lead electrocardiogram along with continuous health monitoring in the emergency room. Unstable angina in patients was defined as ischemic symptoms suggestive of an ACS without elevation in troponin with or without electrocardiogram changes indicating ischemia. Non-ST elevation myocardial infarction (NSTE-MI) in patients was defined as no ST elevation in electrocardiograms but with an increase in cardiac ischemia markers. The diagnosis of STE-MI was identified when a patient had typical ischemic chest pain lasting more than 20 minutes along with one of the following criteria: at least 1 mm ST elevation, the elevation of cardiac markers at least twice of the maximum normal values. In addition, all new cases diagnosed with NSTE-ACS underwent diagnostic angiography. To identify MetS patients, the National Cholesterol Education Program Adult Treatment Panel III (NCEP-ATP III) criteria10) were used. Patients were diagnosed with MetS if they had at least three of the following factors: 1) waist circumference>102 cm in men and >88 cm in women; 2) triglyceride level of ≥150 mg/dL or taking drugs to reduce its level; 3) high density lipoprotein <40 mg/dL in men and <50 mg/dL in women or taking drugs to increase it; 4) blood pressure≥130/85 mmHg or taking antihypertensive drugs; and 5) fasting plasma glucose≥100 mg/dL or taking antidiabetic agents. To identify the incidence of major adverse cardiovascular events (MACE), all patients were followed up to December 2014. All patients with unstable angina were given anticoagulants (antiplatelet plus intravenous heparin), β blocker, angiotensin-converting enzyme inhibitors, nitrate, and statin. NSTE-MI patients were also treated as unstable angina ones. None of our patients underwent revascularization therapy in the hospital. In order to evaluate complete blood count cells, blood samples were collected upon admission and analyzed within 30 minutes of sampling using an automated blood cell counter (Sysmex, Kobe, Japan).
Patient follow-up
We followed all patients for a median of 24 months (Q1: 23 months; Q2: 25 months). Measured clinical outcomes during follow-up period were: 1) coronary artery stenting; 2) non-fatal myocardial infarction; 3) any cause of death. These end points were considered as composite MACE.
Statistical analysis
WMR value was divided into two groups according to its median value: low WMR group (WMR<720, n=175) and high WMR group (WMR≥720, n=156). Patients were compared based on the WMR group. Two subgroup analyses were conducted based on the status of MetS within the WMR group. Continuous variables were reported as either Median (25th and 75th percentiles) or mean±standard deviation and analyzed using Mann-Whitney U test or t-test. Categorical variables were reported as number (percentage). Differences between groups were compared using chi-square test. Kaplan-Meier analysis was performed to detect the proportion of patients remaining MACE-free during follow-up among all patients and in those with or without MetS. Log-rank test was used to compare groups by. In addition, multivariate Cox regression analysis was used to estimate the hazard ratios (HR) of composite MACE incidence for elevated WMR. The multivariate Cox regression models were corrected for all baseline characteristics, drug histories, conventional cardiovascular risk factors, and biomarkers. Composite MACE was entered as a dependent variable. The WMR value was entered as a categorical variable based on its median value. All statistical analyses were performed using SPSS version 18.0 (SPSS Inc., Chicago, IL, USA). A two-tailed p less than 0.05 was considered statistically significant.
Results
Baseline characteristics and biomarkers
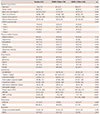
A total of 331 patients (190 males, 57.4%) with mean age of 60±12.5 years were followed and analyzed. All variables were compared between the low WMR group and the high group. Patients in the high WMR group had higher body mass index and waist circumference compared to the low WMR group (p=0.049 and p=0.024, respectively). The frequency of current smoker in the high WMR group was higher than in the low WMR group (21.7% vs. 31.4%, p=0.045). When comparing biomarkers between the two groups, fasting plasma glucose, triglyceride, hemoglobin, platelet count, WBC count, and WMR values in the high WMR group were greater than those in the low WMR group (Table 1). MPV value in the high WMR group was significantly lower than that in the low WMR group (9.8 [9, 10.4] vs. 9.4 [9, 10], p<0.001). High WMR patients had a tendency (p=0.096) to have higher troponin I compared to low WMR patients. Furthermore, the number of patients with NSTE-MI and MetS in the high WMR group was greater than that in the low WMR group (Table 1). The number of MACE incidence at follow-up period in the high WMR group was significantly greater than that in the low WMR group (14.3% vs. 25%, p=0.014).
Subgroup analyses
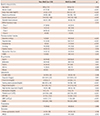
Based on NCEP-ATP III criteria used for identifying MetS, 62.2% of patients in our cohort were diagnosed with MetS. Of measured biomarkers, fasting plasma glucose, triglyceride, platelet count, WBC count, and WMR in MetS patients were significantly higher than those in non-MetS individuals (Table 2). MetS patients had the tendency (p=0.073) of having lower MPV values than non-MetS ones. The number of MACE incidence in both groups was comparable (18.4% vs. 19.9%, Table 2).
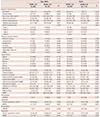
Another subgroup analysis was performed, in which patients with or without MetS were divided into two groups according to WMR values (WMR<720 vs. WMR≥720, Table 3). When comparing MetS patients according to WMR values, patients in elevated WMR group were associated with more MACE incidence at follow-up (11.2% vs. 26.5%, p=0.007). There was no difference between WMR groups regarding the number of patients with NSTE-MI (9% vs. 25.4%, p=0.171). Moreover, among patients without MetS, MACE incidence was comparable between WMR groups (17.4% vs. 20.5%, p=0.681). The number of patients with NSTE-MI in the high WMR group was significantly higher than that in the low WMR group (8.1% vs. 20.5%, p=0.049).
Survival analysis
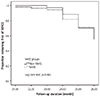
Kaplan-Meier analysis was conducted to compare MACE-free survival between study groups. When comparing patients with or without MetS, there was no difference in MACE-free survival between groups (Fig. 1). Considering all patients, the proportion of patients remaining MACE-free during follow-up was significantly different between the two WMR groups (Fig. 2A). When drawing survival curve for patients with MetS, a significant difference was observed (Fig. 2B). However, such difference was not significant among patients without MetS (Fig. 2C).
Multivariable Cox regression analysis was performed to assess the prognostic value of admission WMR after adjusting for all variables (Table 4). In the first model after entering all patients together, the HR of MACE incidence during follow-up for the high WMR group was 1.856 (95% confidence interval [CI] 1.123–3.067, p=0.016). Among patients with MetS, the HR of MACE incidence for the high WMR group was 2.616 (95% CI 1.282–5.339, p=0.008). In non-MetS individuals, HR of MACE was 1.035 without significance (95% CI 0.439–2.444, p=0.937).
Discussion
WMR as a novel inflammation-based marker has recently been introduced as an independent predictor for long-term cardiovascular events in NSTE-ACS patients.11) In this prospective study, for the first time, we demonstrated that elevated admission WMR values could predict MACE incidence at long-term follow-up in NSTE-ACS patients. This was more pronounced in the presence of NCEP-ATP III-defined MetS. However, it was not observed among patients without MetS.
MetS is a condition accompanying multiple cardiovascular risk factors. Associated with both type 2 diabetes mellitus and cardiovascular disease, MetS is a major public health concern. However, despite the magnitude of studies concerning MetS pathophysiology and prognosis, it has remained to be investigated more to understand its nature and adverse events.8) In a prospective cohort study, Wilson et al.12) had shown that MetS is associated with increased risks of type 2 diabetes mellitus and cardiovascular disease during 8-year follow-up period. In terms of pathologic mechanisms involved in MetS pathogenesis, a cohort study has revealed that inflammation defined by elevated C-reactive protein is correlated with MetS and insulin resistance and that both inflammation and MetS can independently predict new cardiovascular events.9) MetS can lead to increased risk of thrombogenesis and platelet aggregation, resulting in vascular complications.13) It has been postulated that in patients with MetS, platelet hyperactivity leading to thrombogenesis is the main contributor to insulin resistance, dysglycemia, oxidative stress, and inflammation.13) In addition to its effect on platelet activation, MetS also impacts on procoagulant and hypofibrinolytic status associated with inflammatory processes. Therefore, these factors are more likely to predispose individuals to atherosclerosis, venous thrombosis,14) cardiovascular mortality, and stroke.8) In terms of the effect of MetS on the outcomes of ACS patients, some studies have shown that the presence of MetS has been associated with worse prognosis of ACS individuals15) and patients who are undergoing coronary revascularization.16) In a large multicenter study, it has been found that MetS patients have similar outcomes as non-MetS patients among NSTE-ACS cases.17) We also demonstrated that there was no significant difference regarding the MACE incidence between MetS patients and non-MetS patients. This might be due to the presence of NSTE-ACS in our cohort and heterogeneous population. More prospective large studies are needed to identify the exact mechanisms by which ACS patients with MetS predispose to adverse outcomes.
Regarding the relationship between WBC count and the presence of MetS, some studies have been conducted to assess this association. In some cross-sectional studies,18)19)20) it has been found that WBC count in MetS patients is significantly higher than that in non-MetS ones, indicating that inflammation-based mechanism is involved in the MetS pathogenesis. However, Kutlucan et al.21) have found no difference regarding WBC count levels between patients with MetS and those without MetS. We also demonstrated that WBC count in MetS patients was significantly higher that in non-MetS individuals. Concomitant measurement of other inflammatory markers such as C-reactive protein may be of great value to assess this relationship. In addition to WBC count, platelet count and MPV have also been evaluated with inconsistent results among studies. The majority of cross-sectional studies have demonstrated that increased platelet count is associated with MetS patients.19)20)22)23) In a meta-analysis, platelet count in MetS patients was higher than that in non-MetS patients.24) In contrast, in a cross-sectional investigation, there was no difference in platelet count between MetS and non-MetS individuals.21) MPV also has inconsistent results among reports. Park et al.23) have shown that MPV level is lower in MetS patients than that in non-MetS. However, Tavil et al.25) have found that MPV is elevated in MetS patients compared to that in non-MetS ones with normal coronary angiography. However, Kutlucan et al.21) showed no difference in MPV values between patients with MetS and those without MetS. Zaccardi et al.24) demonstrated that MPV levels were comparable between MetS and non-MetS individuals in a meta-analysis. Given these findings, it is more likely that platelet count and MPV levels are in reverse direction among MetS patients, although some studies oppose this hypothesis.
In agreement with the above mentioned results, we found that platelet count was significantly higher in MetS patients compared to that in non-MetS individuals. We found that there was a trend for non-MetS patients to have higher MPV values compared to MetS subjects. These results suggest that WMR might be of great importance in NSTE-ACS cases with MetS as an indicator of decreased MPV and elevated WBC. The reason why MPV is lower in MetS patients may be explained by the notion that the degree of inflammation can change the MPV values. In our cohort, we entered NSET-ACS with different pathophysiology from that of ST elevation myocardial infarction, in which elevated MPV have been associated with cardiovascular outcomes.26) In addition, some other factors including lifestyle modification, antihypertensive, lipid-lowering agents, and diet therapies can also affect MPV values.27) Moreover, the different timespan between developing ACS and laboratory testing may influence platelet size, suggesting that MPV may change during the acute-phase reaction. The association between ACS patients with MetS and increased inflammatory pathways has been shown previously. However, whether such association will certainly result in increased thrombogenicity through elevated MPV remains to be established. It has been shown that both activated and inactivated platelets are involved in leukocyte and platelet conjugation process, a dynamic process in which platelet activation status and leukocytes' adhesion ability will result in different bindings capacity to induce inflammatory and thrombogenicity.28) Large prospective studies with serial MPV measuring will be needed to solve this controversy.
To understand the relations of WBC count and MPV values to MetS, we introduced another novel non-invasive inflammation-based marker of complete blood count named WMR. Based on our findings, WMR was elevated in MetS patients. When comparing WMR groups, WMR≥720 was associated with higher MetS rates and MACE incidence at long-term follow-up. Furthermore, MACE incidence was significantly higher in the high-WMR group among MetS patients. However, it was not significantly higher in non-MetS patients.
Study limitations
This study had several limitations. First, our study had a small sample size. Secondly, our cohort was derived from a larger group of ACS patients. In addition, we excluded ST elevation myocardial infarction without specified MetS cases. Hence, we are unable to prevent selection biases. It is possible that other unmeasured confounding factors might have influenced our study findings. Although WMR may be considered as an inflammatory marker, unfortunately, we did not measure other inflammatory markers such as C-reactive protein to show any comparison between WMR and such markers. Finally, our cohort included more unstable angina patients compared to NSTE-MI. Some NSTE-ACS cases underwent revascularization at the time of this study. Therefore, our findings can be generalizable to NSTE-ACS without revascularization. However, our findings can be of great importance among NSTE-ACS patients. Future studies will be helpful to show the prognostication of WMR in such cases.
Conclusion
This study showed that elevated admission WMR value was strongly related to the presence of MetS among NSTE-ACS individuals. Furthermore, high WMR was associated with increased long-term MACE-free survival in patients with MetS, but not in non-MetS individuals. Further large-scaled studies are needed to clarify this relationship and identify the role of WMR in the risk assessment of ACS patients with metabolic diseases.


 XML Download