

 PDF
PDF ePub
ePub Citation
 Print
Print


Introduction
The transplanted heart is anatomically and functionally denervated. Reinnervation of the transplanted heart is crucial to the autonomic nervous system (ANS)'s physiologic control of cardiac performance.1)2)3) Many previous studies have investigated the autonomic reinnervation of the transplanted heart, and sympathetic reinnervation is now a generally accepted phenomenon.4)5)6)7)8) However, the occurrence of parasympathetic reinnervation has not been clearly identified. Animal experiments revealed that early parasympathetic reinnervation occur after heart transplantation (HTx) – within 6-7 weeks in amphibians and 2-6 months in canine and primate models.9)10) The results in humans have been controversial. Previous studies that assessed reinnervation using heart rate variability (HRV) indicated that parasympathetic reinnervation is absent during the first 24 months after HTx, and is undetectable for at least 5 years.6)11)12) In the late 1990s, Bernardi et al.13) reported that early parasympathetic reinnervation was observed 6 to 11 months after HTx. Compared with patients who undergo HTx using the biatrial (standard) technique, Bernardi et al.13) found that parasympathetic reinnervation occurs more frequently in patients who undergo HTx using the bicaval technique.
Although the study of parasympathetic reinnervation has been difficult because of the lack of an accurate, definite method to evaluate reinnervation, HRV has been widely used in previous studies for the noninvasive assessment of parasympathetic reinnervation.14)15)16)17) Direct vagal stimulation is an invasive but confirmative method, which can be used to evaluate the reinnervation of vagal input to the denervated heart. Animal experiments have revealed that immediate slowing of the heart rate (HR) with the initiation of electrical stimulation of the vagus nerve is a reliable indication of parasympathetic reinnervation.10)
The objectives of our study were to use HRV and direct stimulation of the cardiac branches of the vagus nerve to evaluate the timing and the degree of parasympathetic reinnervation early (<1 year) after bicaval HTx.
Subjects and Methods
Study population
Patients who had received HTx using the bicaval technique (Seoul National University Hospital, Seoul, Korea) were eligible for the study. Patients who were <19 years of age, were diagnosed with an infectious disease, had experienced allograft rejection or heart failure symptoms, were not in the normal sinus rhythm, or had a pacemaker, were excluded from the study. The study consisted of two series. The first series was a post-HTx cross-sectional HRV analysis conducted over time. Patients who had received HTx>6 months previously underwent 24-hour Holter monitoring. Data from this monitoring was used to calculate the HRV parameters. Patients were assigned to the early (>6 months to <1 year), intermediate (1 to 2 years), or late (>2 years) group, based on the duration between HTx and the HRV study.
In the second series, we planned to identify the changes in the HRV parameters that occurred early after HTx and to find direct evidence supporting the reconnection of vagal input to the transplanted heart. If the HRV results indicated that incremental changes had occurred over time, and that RR-interval change occurred immediately after direct vagal stimulation, then the presence of parasympathetic reinnervation could be explained by the vagus nerve reconnection. The patients who had received HTx within 6 months before the start of the investigation were included in direct vagal stimulation and HRV studies, which were performed at 6 and 12 months after HTx. Each patient's last HRV result was included in the first series of the study, which was designed for cross-sectional HRV analysis over time after the HTx. Patients taking a beta-blocker or calcium channel blocker discontinued the medication 5 days before the direct vagal stimulation and the HRV study.
The study was performed in accordance with the International Conference on Harmonization Guideline for Good Clinical Practice and the ethical principles outlined in the Declaration of Helsinki.18) The protocol was approved by the Institutional Review Board (Seoul National University Hospital, Seoul, Korea) before the study was initiated. Written informed consent was obtained from each patient before the screening procedure was performed.
Heart rate variability
The data obtained from the 24-hour Holter monitoring included time-domain variables (the means of all the RR-intervals between normal beats [mean NN]; the standard deviation of the mean of all the RR-intervals [SDNN]; the standard deviation of the mean of the RR-intervals taken in 5-minute segments [SDANN]; the means of all 5-minute standard deviations of the NN intervals [ASDNN]; the square roots of the differences between the consecutive RR-intervals [RMSSD]; the percentages of the differences between the successive NN intervals over 24 hours that were >50 msec [pNN50]) and the frequency domain variables (variance of all the RR-intervals [total power]; the activity within the range of 0.04 to 0.15 Hz [low-frequency, LF]; and the activity within the range of 0.15 to 0.4 Hz [high-frequency, HF]). The RMSSD is known as a specific indicator for parasympathetic reinnervation among time-domain variables.19) Also, the HF component is thought to represent predominantly parasympathetic control of the HR because it can be blocked by atropine.20) Therefore, the RMSSD and the HF values were used to indicate whether parasympathetic activity was present or absent in this study.
Direct vagal stimulation
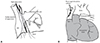
Vagal stimulation was performed at 6 and 12 months after the HTx, at the same time that the patients received an endomyocardial biopsy for post-HTx rejection surveillance. The right internal jugular vein was punctured and a 6-F sheath was inserted. If the endomyocardial biopsy was performed without complications, a 6-F steerable quadri-polar catheter (St. Jude Medical, Inc., St. Paul, Minnesota, USA) was placed in the superior vena cava (SVC), just above the suture line, for fluoroscopy-guided stimulation of the cardiac branches of the recipient's right vagus nerve (Fig. 1).21) Vagal stimulation was performed by applying high-frequency electrical stimulation (16.7 Hz, 1 msec pulse width) via an external pacemaker (Biotronik EDP 20/B Recor S, Biotronik, Berlin, Germany). Stimulation began at 4 V, and was gradually increased to 10 V in the 1 to 12 o'clock direction to locate the point at which HR slowing occurred. Vagal reinnervation was defined as a >10% reduction in the HR, compared with the baseline HR value immediately after the electrical stimulation. A 12-lead electrocardiogram was used to continuously record and analyze for the presence of changes in the RR-intervals.
Statistical analysis
The results for the quantitative variables were expressed as the means, standard deviations, and ranges. The results for the qualitative variables were summarized as absolute values and percentages. Nonparametric tests for the non-paired data were used to compare the HRV variables among the subjects. The Mann-Whitney U test was used when two groups were compared, and the Kruskal-Wallis test with Bonferroni's correction was used when three groups were compared. The Jonckheere-Terpstra test was used to evaluate the trends between the three groups (early, intermediate, and late after the HTx). The correlations between the time after HTx and the HRV parameters were calculated using the Spearman correlation test. The Wilcoxon signed-rank test was performed when comparing the repeated HRV measurements at 6 and 12 months after the HTx. We used SPSS 17.0 software for Windows (SPSS Inc., Chicago, IL, USA) for the statistical analysis.
Results
Baseline characteristics
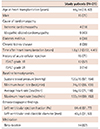
A total of 21 consecutive patients (15 men; mean age 44±14 years) were enrolled in the study. Direct vagal stimulation was performed on the eight patients who had received HTx within the previous 6 months. The time between the HTx and the HRV studies ranged from 0.52 to 4.41 years (mean, 1.8±1.2 years). The underlying disease most often treated by HTx was idiopathic dilated cardiomyopathy (n=9, 43%), followed by ischemic cardiomyopathy (n=4, 19%). The results for the clinical characteristics of the study patients are summarized in Table 1. Eight patients (38%) had diabetes mellitus. Fifteen patients (71%) had a history of acute cellular allograft rejection. These patients did not experience severe rejection; rejection was indicated by the histological findings obtained from the scheduled endomyocardial biopsies. The mean systolic blood pressure was 125±15 mmHg (range, 97 to 154 mmHg) and the average, minimum, and maximum HR values were 94±12, 74±12, and 133±14 beats per minute, respectively. Every patient was prescribed a standard immunosuppressive regimen that included tacrolimus, mycophenolate mofetil, and a steroid. Fourteen of the patients (67%) were prescribed beta-blockers.
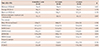
Heart rate variability increased with time after the heart transplantation
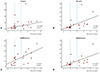
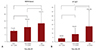
The values for the HRV parameters increased with time after HTx. The ASDNN and RMSSD significantly increased with the time after HTx (Fig. 2). The results also indicated that the increases in LF and HF values were significant (Fig. 2). Each patient was classified into the early (<1 year), intermediate (1 to 2 years), or late (>2 years) group for analysis. There were no significant among-group differences in the baseline characteristics, including the patient age at HTx, underlying disease, echocardiographic parameters, prevalence of rejection, or prescribed medication. The results for the Holter and HRV parameters are presented in Table 2. The differences between the minimum and maximum HR significantly increased with time after HTx (mean, 51±13, 59±12, 65±13, p for trend=0.047), as did ASDNN (p for trend=0.026). RMSSD, HF, and pNN50 are related to parasympathetic reinnervation, and all showed incremental changes with time after HTx (p for trend, 0.011, 0.016, and 0.015, respectively). RMSSD and HF were significantly higher in the >2 years after HTx group (late; n=9) compared with the <1 year after HTx group (early; n=6) (late vs. early: RMSSD, 13.3±7.3 msec vs. 7.7±0.8 msec, p=0.012; HF, 17.8±18.5 ms2 vs. 3.8±0.9 ms2, p=0.012) (Fig. 3).
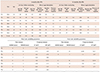
Direct vagal stimulation in patients early af ter heart transplantation Direct vagal stimulation at the time of the scheduled endomyocardial biopsy was performed in eight patients at 6 months after HTx. The results for direct vagal stimulation and 24-hour Holter monitoring recorded at the same time point as the stimulation study are presented in Table 3. All the patients were hemodynamically stable during the stimulation and finished the study within 5 minutes without complications. Before the stimulation, the mean baseline HR was 81±10/min (range, 68 to 100/min) and the mean baseline RR-interval was 748±93 msec (range 600 to 880 msec). No significant changes in the HR or RR-interval occurred during direct stimulation of the vagus nerve at 6 months after HTx.
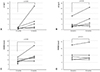
HRV and direct vagal stimulation measurements were repeated in 5 of these 8 patients at 12 months. One patient could not visit the hospital at 12 months after HTx due to a personal reason and 2 patients withdrew their agreement for study participation. The results of the HRV analysis at 6 and 12 months after HTx are summarized in Table 3 and Fig. 4 for these patients. There were no statistically significant increases in any of the parameters. Four of the 5 patients had incremental changes in ASDNN, LF, and HF. Patients 2 and 5 had HF values>8.08 ms2, which has been suggested to be evidence of parasympathetic reinnervation15) and 4 of the 5 patients showed incremental changes in HF values. Despite the findings obtained during the HRV follow up, which implied that early progressive parasympathetic reinnervation had occurred, there were no changes in the HR or RR-intervals during direct vagal stimulation at 12 months after HTx (mean baseline HR 83±11/min, [range 68 to 91/min], mean baseline RR-interval 732±103 msec, [range, 660 to 880 msec]).
Discussion
The changes in HRV parameters suggested that early parasympathetic reinnervation occurred in this study population. Our findings also indicated that the early sympathetic reinnervation was not related to the direct reconnection of major cardiac branches of the vagus nerve along the SVC. To the best of our knowledge, this is the first time that this finding has been reported.
The time course of sympathetic reinnervation after HTx has been investigated using radionuclide studies with catecholamine analogs and HRV in many previous studies4)5)7)8) and is relatively well-established compared to parasympathetic reinnervation. Partial sympathetic reinnervation begins from 12 to 18 months after HTx and continues progressively over time.4)5) Bengel et al.1) quantified sympathetic reinnervation using positron-emission tomography and [11C] hydroxyephedrine and the restoration of sympathetic reinnervation is associated with improved responses of the HR and contractile function to exercise. However, little is known about the clinical implication of parasympathetic reinnervation in HTx recipients. Recent study reported that parasympathetic reinnervation assessed by HRV, especially HF power, showed significant association with the improvement of post-exercise HR recovery ability and quality of life.3)
Early parasympathetic reinnervation has been reported in animal studies.9)10) Regenerating synapses have been found on post-ganglionic axons in amphibians at 4-5 weeks after crushing injuries at the cardiac branches of the vagus nerve and the vagal synapses reinnervated to neuronal cell bodies at 6-7 weeks.9) Kondo et al.10) demonstrated the early parasympathetic reinnervation in mammals using stimulation of the cervical vagus nerve. The investigators defined the presence of parasympathetic reinnervation as an immediate reduction in HR and they concluded that parasympathetic reinnervation occurs between 60 and 126 days after HTx. The nerve regeneration process in mammals has been proposed to be different from the process in amphibians. In mammals, regeneration occurs at the proximal stump of the severed nerve, and axons sprout and grow towards the distal side while amphibian nerves regenerate from postganglionic axons. According to this hypothesis, vagal reinnervation in mammals begins from the extrinsic cardiac ANS to the intrinsic cardiac ANS and from the pre-ganglionic neurons to the postganglionic neurons. Murphy et al.22) found direct anatomical evidence of autonomic nerve regeneration and reinnervation to the transplanted canine's heart by 1 year after HTx. They used a specific neuronal tissue marker and found relatively large nerve bundles crossing over the anastomotic suture lines of the great vessels and atria.
The occurrence of parasympathetic reinnervation in humans has been questioned. Except for a few remaining post-ganglionic parasympathetic neurons from donor tissue, there has been no histological evidence of myocardial reinnervation in humans until long after HTx (i.e., 10 years).23) The results of physiologic and pharmacologic studies have also suggested that parasympathetic reinnervation might not occur until 8 years after HTx.6)11)12) However, with the emergence of a new surgical procedure known as the bicaval technique in the early 1990s, early parasympathetic reinnervation was found within 1 year of the patients receiving a bicaval HTx.13) Bicaval surgery anastomoses the recipient's inferior vena cava and SVC to the donor heart's right atrium (Supplementary Fig. 1 in the online-only Data Supplement). The pre-ganglionic parasympathetic axons (mainly axons of the vagus nerve) are severed to a larger extent and at a more proximal location compared with the standard biatrial technique. This difference could result in a strong stimulation for reinnervation. Bernadi et al. suggested that nerve regeneration was more likely to occur when a greater number of nerves are severed.13) However, whether parasympathetic reinnervation occurs is still controversial in the bicaval HTx era. One of the reasons is that there is no confirmative method for the diagnosis of parasympathetic reinnervation. HRV has been widely used in previous studies for the assessment of parasympathetic reinnervation,14)15)16)17) but the pitfall in the use of HRV for evaluating parasympathetic reinnervation is the absence of a definitive cut-off value. Despite this limitation of HRV, many previous studies reported evidence of parasympathetic reinnervation based on HRV results by defining an arbitrary cut-off value in each small study population or by identifying incremental changes in values.6)15)16)20)24) After comprehensive review of previous studies, we interpreted incremental changes in HRV values as an indicator of progressive parasympathetic reinnervation.
We could observe the progressive nature of parasympathetic reinnervation by examining the correlation between parasympathetic activity and time after HTx. The HRV results suggested the presence of trends that increased with time. HF, in particular, increased early after HTx in 4 of the 5 prospectively examined patients. However, reinnervation was not explained by reconnection or regeneration of the vagus nerve, as there was a negative response to direct vagal stimulation. The question still remains of how early parasympathetic reinnervation can be explained. The large bundle of the vagus nerve might not reconnect within 1 year after HTx. The vagus nerve may never reconnect, or vagus nerve regeneration may begin after 1 year. In either case, vagus nerve reconnection was not the main component of early parasympathetic reinnervation. We can hypothesize, therefore, that early parasympathetic reinnervation begins through the posterior sides of both atria rather than from large nerve bundles such as the vagus nerve. The posterior sides of the atria contain abundant autonomic nerve networks, and are located at a relatively shorter distance from the recipient to the donor for regeneration of the synapses or axonal growth. The connection between the extrinsic and intrinsic autonomic ANS, and the establishment of fine and gradual reinnervation, might be achieved from the posterior wall of the left atria to the entire transplanted heart. Further animal experiments and histological evaluation of transplanted human hearts (e.g., from autopsy or transplanted heart specimens from repeatedly transplanted patients) are needed to determine the origin of parasympathetic reinnervation.
Study limitations
There were some limitations to this study. First, the small sample size may have limited the statistical power of this study. However, direct vagal stimulation is not an established or routinely used method for evaluating parasympathetic reinnervation in humans. Our study was a pilot study to determine the diagnostic value of direct vagal stimulation on parasympathetic reinnervation. Although we could not perform serial HRV and direct vagal stimulation in a large population, the comparison of HRV and direct vagal stimulation might show the association between early parasympathetic reinnervation and vagal nerve reconnection.
Second, the follow up duration for direct vagal stimulation was only 12 months. This time period may not have been sufficient to detect the development of vagal reinnervation. Long-term prospective follow up studies using direct vagal stimulation and HRV are needed to describe the process of vagal reinnervation. In addition, for assessing the clinical impact of vagal reinnervation, data from cardiopulmonary exercise tests and patients' clinical outcomes should be collected in further investigation.1)3)
For reliable HRV tests, we controlled the medications that could affect the results, excluded patients who had significant arrhythmia or frequent ectopic beats and used longer recording periods (up to 24 hours) than previous studies (10 to 20 minutes) to collect more inclusive data on general autonomic activity.25) However, we could not control each patient's physical activity and the effect of circulating catecholamine on the HRV results.26)
Lastly, use of direct vagal stimulation is not widely accepted for the evaluation of vagal reinnervation. However, we applied this technique in a pilot study of control patients who had not received HTx; an immediate reduction in HR was observed in all patients.
Conclusion
Parasympathetic reinnervation seems to begin in the early period (<1 year) after HTx when the bicaval technique is used. Reconnection of the major branches of the vagus nerve may not be related to this early reinnervation. Further investigations are needed to identify how and where early parasympathetic reinnervation is initiated.
 XML Download