

 PDF
PDF ePub
ePub Citation
 Print
Print


Introduction
The pathogenesis of acute coronary syndrome (ACS) involves a complicated interaction between atherosclerotic plaque characteristics and coronary flow dynamics, including wall shear stress (WSS) and intrinsic hemostatic/fibrinolytic dysfunction.1) A mechanical injury caused by increased WSS of blood flow can be considered an inciting event for plaque rupture.2)3)4) It is known that whole-blood viscosity (WBV) can be increased due to elevated hemorheological parameters, including hematocrit, fibrinogen, immunoglobulin, and triglycerides.5)6)7)8) Increased WBV may lead to high shear forces at the vascular endothelium, promoting the rupture of an occlusive plaque.9)10) It has also been reported that increased WBV at a low shear rate in patients with ACS is associated with coronary plaque rupture.11) Since WBV can be modified using drug therapy, as shown in hemodilution, low-density lipoprotein cholesterol (LDL-C) apheresis, and fibrinolysis,12)13) WBV may be a therapeutic target.
Beyond their lipid-lowering effects, statins also have a different potential mechanism, a rheological effect.14) However, there have been limited reports on the effect of statins on blood viscosity.15)16)17) Moreover, there are no studies of statin effects on patients with ACS in terms of WBV. Therefore, the aim of this study was to investigate the effects of statins on WBV in patients with ACS.
Subjects and Methods
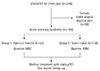
We enrolled a total of 248 consecutive patients admitted to the emergency room of Chonbuk National University Hospital (Jeonju, Korea) for chest pain evaluation from April 2013 to March 2014. Among the recruited subjects, 59 non-ACS patients were excluded, and the remaining 189 patients with ACS were divided into two groups according to their previous statin medication use: patients who had used statins for more than 3 months before admission (group I, n=51) and statin-naïve patients (group II, n=138) (Fig. 1). The present study was performed after approval from the ethics committee of Chonbuk National University Hospital. Patients were enrolled after providing written informed consent.
Since most previous large randomized trials for evaluating the short-term effects of statins had been performed during the first 2-3 months of statin administration,18) group I in this study was defined as patients who had taken statins for more than 3 months before enrollment. The mean duration of statin administration before enrollment was 7.3±4.0 months, and the type of statin used by patients in group I varied (atorvastatin: n=26, 51.0%; rosuvastatin: n=12, 23.5%; pitavastatin: n=6, 11.8%; simvastatin: n=4, 7.8%; or simvastatin/ezetimibe: n=3, 5.9%).
Diagnostic angiography through the femoral artery was performed after premedication with aspirin (300 mg) and clopidogrel (300 mg or 600 mg). Anticoagulation with intravenous unfractionated heparin (2000 units) was administered to all patients. If percutaneous coronary intervention (PCI) was performed in patients with ACS, additional unfractionated heparin was infused throughout the procedure to maintain an activated clotting time of 250 seconds or longer. We excluded patients with a history of recent thrombolysis in myocardial infarction, major bleeding, major surgery within one month, cardiogenic shock, uncontrolled severe hypertension, contraindication to antiplatelet agents (such as aspirin or clopidogrel), previous history of myocardial infarction, multiple coronary stenosis (diameter stenosis>50%) requiring staged PCI, severe valvular heart disease, concurrent infection, drug abuse, or severe hematological disease, including anemia (hemoglobin<10.0 g/dL). Patients under 18 or over 80 years of age were also excluded. All patients were administered standard medication, including rosuvastatin (16.2±4.9 mg; 20 mg, 62.5%; and 10 mg, 37.5%) for one month after enrollment.
Clinical and laboratory characteristics were analyzed between groups at baseline and at the one-month follow-up. Baseline blood samples for WBV were collected as soon as patients visited emergency room prior to drug or fluid administration to decrease the likelihood of a change in WBV by fluids. The time needed for blood sampling and WBV analysis was minimized in order to reduce errors caused by changes in blood properties.
The viscosity (µ) of liquid is mathematically defined as the ratio of WSS (τw) to wall shear rate as described by the following equation.

Blood viscosities at shear rates of 1 s-1 (diastolic blood viscosity; DBV) and 300 s-1 (systolic blood viscosity; SBV) were measured with a scanning capillary tube viscometer (Bio-Visco Inc., Jeonju, Korea)19) at both baseline and one month after statin medication. DBV represents the hemorheological state of blood corresponding to a very slow flow, as in microvessels, where the aggregated erythrocytes could result in increased flow resistance. SBV indicates the opposite state, which corresponds to high velocity and high WSS, such as peak flow in epicardial coronary arteries.6) Red blood cell (RBC) properties, including deformity and aggregation, were measured according to the most recent International Society for Clinical Hemorheology guidelines by a microfluidic hemorheometer (Rheoscan-AnD300; Rheo-Meditech, Seoul, Korea).20)
For continuous variables, comparisons between the two groups were made using the Student's t test. Fischer's exact test was used to evaluate categorical variables. All continuous variables are described as means±standard deviation. Two sample t tests were performed to compare baseline and post-treatment statuses in group II. The Pearson product moment correlation coefficients between WBV and various blood factors were estimated. The significant difference between two estimated correlation coefficients was tested based on a z score using Fisher's z transformation. All analyses were twotailed, with clinical significance defined as a p<0.05. All statistical processing was calculated using SPSS-PC 18.0 (Statistical Package for the Social Sciences, SPSS-PC. Inc., Chicago, IL, USA).
Results
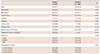
There were no statistical differences in baseline clinical characteristics between the two groups except age (group I vs. group II: 64.5±9.6 years vs. 60.1±11.2 years, p=0.014), hypertension (78.4% vs. 44.2%, p<0.001), diabetes (41.2% vs. 22.5%, p=0.02), previous history of ischemic heart disease (58.8% vs. 9.4%, p<0.001), and use of anti-platelet agents, including aspirin (68.6% vs. 18.8%, p<0.001) and clopidogrel (29.4% vs. 3.6%, p<0.001) (Table 1).
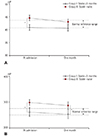
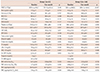
Baseline laboratory findings were not different between groups, except for LDL-C level (77.3±16.7 mg/dL vs. 108.6±32.3 mg/dL, p<0.001) (Tables 2 and 3). In group II, baseline WBV was higher than that in group I (SBV: group I vs. group II, 40.8±5.9 mP vs. 44.2±7.4 mP, p=0.003; DBV: 262.2±67.8 mP vs. 296.9±76.0 mP, p=0.002). At the one-month follow-up, only DBV of group II was significantly higher than that for group I (SBV: group I vs. group II, 40.6±0.5 mP vs. 42.0±2.0 mP, p=0.142; DBV: 250.3±82.7 mP vs. 281.4±52.6 mP, p=0.027) (Fig. 2). The two-sample t-test revealed a significant change of the WBV in group II (SBV: 44.2±7.4 mP vs. 42.0±2.0 mP, p=0.012; DBV: 296.9±76.0 mP vs. 281.4±52.6 mP, p=0.044) (Table 4).
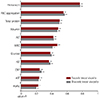
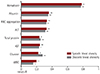
Baseline hermatocrit, RBC aggregation, total protein, and albumin showed the highest linear associations with the baseline WBV in the correlation analysis (Fig. 3). One month hematocrit, albumin, RBC aggregation, and alanine aminotransferase also showed the highest linear associations with the WBV in the correlation analysis (Fig. 4). However, LDL-C level was not related to WBV at either baseline (SBV: R2=0.074, p=0.326; DBV: R2=0.073, p=0.337) or the one-month follow-up (SBV: R2=0.104, p=0.265; DBV: R2=0.112, p=0.232).
A comparison of the laboratory findings at admission to those after one month revealed that white blood cells (WBC) and aspartate aminotransferase (AST) were reduced in group I, while WBC, AST, LDL-C, and C-reactive protein were decreased in group II (Table 2).
Discussion
This study investigated the effects of rosuvastatin on the change in WBV both in previously statin administered and in statin-naïve ACS patients. Our study was the first investigation to show the effectiveness of early intensive rosuvastatin administration in statin-naïve ACS patients in terms of blood viscosity. Our results provide increased evidence to support the early use of rosuvastatin in patients with ACS. Based on previous studies of WBV changes in ACS patients,11) a significant correlation between increased WBV and ACS has been revealed. Nevertheless, a new method or treatment for adjusting increased WBV has not been suggested. Even though there have been attempts to reduce WBV using phlebotomy21) and other medications, no treatments have shown clinical impact to date. In addition, aspirin, an antiplatelet agent, also showed no significant effects on WBV.22)
Blood viscosity can be affected by various factors (i.e., measuring time and medication).23) In several clinical studies, the point at which WBV measurements were taken was not constant, and the effect of medication had not been fully considered. Moreover, the change in WBV may be more variable in patients with ACS, so it is very important to consider the hemorheological status of the patient and early blood sampling before administration of usual cardiovascular drugs (such as anticoagulants or antiplatelet agents) or fluids. In our previous study, the limitations were the timing and location of blood sampling (coronary artery sampling after the administration of drugs — i.e., antiplatelet agents, anticoagulants, and contrast media).11) In order to resolve this issue, early blood sampling in the emergency room and rapid analysis within 4 hours after blood sampling using automated equipment were applied in this study. As a result, an accurate and reliable WBV was obtained. Baseline laboratory findings (Table 2) indicated that LDL-C level was significantly lower in group I compared to the statin-naïve group II patients. Similarly, WBV at admission was significantly lower in group I (Fig. 2). After one month of statin administration, the WBV reduction was noted in the statin-naïve group II. Our previous study to determine the reference interval for WBV revealed that the reference intervals for WBV in healthy adults were 41.3-44.1 mP at shear rates of 300 s-1 (SBV) and 253.3-260.9 mP at shear rates 1 s-1 (DBV).24) Therefore, the WBV of group II at admission was above the reference interval and it decreased significantly after one month. Since plaque rupture in ACS patients is closely related to WSS and WBV,2) the decrement of WBV caused by statin can be another possible explanation for effectiveness of intensive statin administration, particularly in statin-naïve ACS patients.
The effects of statins on WBV have been debated. Some studies showed a favorable influence of statins on the alteration of WBV,13)15)17)25) while other results suggest that statins were ineffective.16)26) However, there have been no studies on the effect of statin in patients with ACS in terms of WBV. We hypothesize that intensive statin treatment (i.e., rosuvastatin) can affect WBV, and we evaluated the alterations in WBV after rosuvastatin administration. Interestingly, though there were correlations between traditional factors (i.e., hematocrit, protein, albumin) and WBV,25) there were no statistical correlations between LDL-C level and WBV (Figs. 3 and 4). These results imply statin has an effect on changing viscosity that was not caused by decreasing of LDL-C level. How then could a statin decrease the WBV? Larger studies for red cell aggregation/deformability and other pleiotropic effects are needed to answer this question.
There are several limitations in the present study. First, only one type of statin was used in this study, and most patients were administered a moderate-dose. Therefore, it is questionable whether different types of statins would show the same effects. Second, there were differences in baseline age, diabetes, diagnosis of myocardial infarction, previous ischemic heart disease history and anti-platelet therapy (i.e., aspirin, clopidogrel) between the two groups. Our previous study for reference interval of WBV revealed age and sex differences even in healthy volunteers.27) Considering the multiple risk factors in group I, WBV should have been higher in group I than in group II. However, the WBV of group I was lower than that in group II. We could not exclude the possible role of confounding variables, such as the relative short duration of rosuvastation administration (one month) in statin-naïve group II patients compared to group I patients (4-months) or the effect of anti-platelet agents or acute phase reactions. Third, there was no imaging or physiologic study to determine the relationship between coronary blood flow and WBV.


 XML Download