

 PDF
PDF ePub
ePub Citation
 Print
Print


Introduction
Pulmonary arterial hypertension (PAH) is a progressive disease that can cause right ventricular (RV) dilatation and dysfunction as a result of increased pulmonary vascular resistance (PVR) and pulmonary arterial (PA) pressure.1)2) Echocardiographic evidence of RV systolic dysfunction and clinical features of right-sided heart failure have been regarded as the main determinants of morbidity and mortality in patients with PAH.3)4)5)
Despite the obvious clinical importance of assessing RV systolic function, the estimation of RV function can be challenging.6)7) Because of their invasiveness and/or high-cost, right heart catheterization (RHC) and cardiac magnetic resonance imaging (CMR) are impractical for frequent serial assessment. Although transthoracic 2-dimensional echocardiography (2DE) provides important information about RV anatomy, function and hemodynamic status, the complex geometry of the RV makes accurate assessment by conventional 2DE difficult.8) Moreover, conventional 2DE measures including velocity and displacement based analyses can be affected by translational motion of the heart and respiratory variation.9)
Two-dimensional strain echocardiography has been introduced to assess regional and global RV function in various disease categories including PAH.6)10)11)12) Because longitudinal shortening contributes to overall RV systolic function, RV longitudinal strain (RVLS) assessed by strain echocardiography can give direct information about regional and global RV mechanics. However, there are relatively small numbers of validation data in RV strain measurement. Thus, we compared RVLS with functional capacity and invasive hemodynamic data by RHC in patients with primary PAH.
Subjects and Methods
Study population
We retrospectively studied consecutive adult patients (>18 years of age) with World Health Organization (WHO) group 1 PAH evaluated from February 2000 to December 2007 in the PAH clinic of Cleveland Clinic. All patients fulfilled the contemporary diagnostic criteria,13) and they had regular outpatient follow-ups in this institution. Patients with left ventricular (LV) systolic dysfunction, significant valvular heart disease, chronic thromboembolic disease, and pulmonary parenchymal diseases were excluded in this study. We included and analyzed echocardiographic data without change of medication during the time interval between echocardiography and RHC. Patients without baseline echocardiographic examination or RHC in this institution, with poor echocardiographic images unable to analyze, atrial fibrillation, or medication change during time interval of two examinations were excluded. This study protocol was approved by the Cleveland Clinic Institutional Review Board.
Echocardiography
Conventional 2DE examinations were performed according to the guidelines and standard recommendations of the American Society of Echocardiography and were recorded digitally.14) In our institution, all echocardiographic images are stored digitally into echocardiographic database with digital imaging and communications in medicine standard format. Echocardiographic images were reviewed by sonographers unaware of the clinical, laboratory, and hemodynamic information. Conventional 2DE parameters were measured by an investigator. RV fractional area change (RVFAC) was calculated from the apical 4-chamber view using the percentage change in areas of the end-diastolic and end-systolic areas of the RV. The tricuspid annular plane systolic excursion (TAPSE) was recorded with M-mode echocardiography parallel to the lateral RV wall and across the tricuspid annular plane and measured as the distance of systolic movement of the RV annulus in the longitudinal direction.8) RV Tei index was defined as the ratio of isovolumic relaxation time (IVRT) and isovolumic contraction time (IVCT) divided by ejection time (ET) of RV.8) RV free wall thickness was measured using M mode from the subcostal view at the peak of the R wave at the level of the tricuspid valve chordae tendineae. RV Tei index was defined as the ratio of IVRT and IVCT divided by ET of RV.8) PA systolic pressure was estimated from the maximal continuous-wave Doppler velocity of the tricuspid regurgitation (TR) jet imaged from multiple planes plus estimated central venous pressure calculated by the diameter of inferior vena cava and distensibility.8) An average of three measurements was used for all analyses.
RV strain and strain rate were analyzed off-line with Velocity Vector Imaging (VVI) software (Axius, Siemens Medical Solutions, Mountain View, CA, USA). After manual tracing of the endocardial border of the RV (about 10 to 16 points) over one frame, the endocardial borders were automatically tracked throughout the cardiac cycle. Myocardial velocity is derived as the ratio between frame-to-frame displacement of the speckles and the time interval.12) Global longitudinal strain and time-to peak strain were calculated. Negative strain values indicate tissue shortening and a smaller value (that is, higher absolute value) indicates better RV systolic function. Global longitudinal strain of RV (RVLSglobal) was calculated by the average of six segmental values of the lateral wall and interventricular septum. Global longitudinal strain of RV free wall (RVLSFW) was measured by the averages of three segmental values (base, mid and apex) of the lateral wall.
Right-sided heart catheterization and other dataset
RHC was performed using a 7-Fr balloon-tipped fluid filled catheter. Hemodynamic data included the PA systolic pressure (sPAP), mean PA pressure (mPAP), pulmonary capillary wedge pressure (PCWP), right atrium and RV pressures, and cardiac output. Cardiac output was determined by the Fick method. PVR was calculated using the formula (mPAP-PCWP)/cardiac output and reported in Wood units. A 6-minute walking distance was performed according to the American Thoracic Society protocol.15) Total distance walked, expressed in meters, was recorded. Brain natriuretic peptide (BNP) was measured by Triage immunoassay reagents (Biosite, San Diego, CA, USA) formatted for Beckman Coulter instrumentation (Brea, CA, USA).
Reproducibility
Longitudinal strain measurements for each patient were performed offline in a blinded manner by two independent observers. Each observer performed two independent measurements of regional and global RV strain values with VVI on same echocardiographic images in a randomly selected 10 patients.
Statistical analyses
The data were analyzed using SPSS version 20.0 (SPSS Inc., Chicago, IL, USA) and MedCalc version 12.4 (MedCalc Software, Mariakerke, Belgium). Summary data are expressed as mean values±standard deviation or percentage of patients. Linear regression analysis was performed to evaluate the relationship between RVLS and other functional or invasive hemodynamic variables. Data were compared by independent samples t test or Mann-Whitney U test. A paired Student t test was applied to evaluate the difference of basal and follow-up values. In the variables without normal distribution, Wilcoxon signed rank test was used to evaluate the difference. To assess the overall differences on RVLSglobal between groups without versus with change of treatment (i.e. treatment initiation or intensification), applied a Linear Mixed Effects model with unstructured covariance for random effects was. Effects of groups were tested as a factor, time after initial echocardiographic assessment as a covariate, as well as time×group interactions. Variability was tested with 2-way analysis of variance with calculation of intra- and inter-observer standard error or measurement (SEMintra and SEMinter). SEMintra expresses the random error by a single observe, while SEMinter is an indicator of the mean variation between different observers.16) All tests were two-sided and p value<0.05 was considered statistically significant.
Results
Patient characteristics
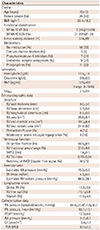
A total 34 patients (29 females, mean age 45±13 years old) with WHO group I PAH {Dana Point group I: 26 idiopathic, 5 familial, and 3 associated with other diseases (2 with connective tissue disease and 1 with systemic to pulmonary shunt)} were included in this study. Their mean duration of disease was 23±31 months (range 0-94 months) and the majority of patients were WHO functional class II (29%) and III (62%). Their mean time interval between echocardiography and RHC was 5 days (range: 0-30 days). Twenty patients had been diagnosed as PAH in this institution and the remaining 16 patients were transferred from other hospitals. Eighteen patients had no specific pulmonary vasodilator therapy at baseline. Eight patients were taking a single vasodilator medication {1 on a phosphodiesterase-5 inhibitor (PDE5I), 3 on an oral endothelin receptor antagonists (ERA), and 4 on prostaglandins} and 8 patients were taking a combination of vasodilators (3 on ERA and prostaglandins, 3 on PDE5I and prostaglandins, and 2 on PDE5I, ERA, and prostaglandins). The baseline clinical, laboratory, echocardiographic, and hemodynamic data (Table 1) were typical for a PAH population, with normal LV systolic function, elevated PA pressure, RV enlargement, and RV systolic dysfunction.
Right ventricular strain findings
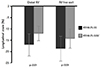
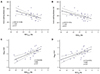
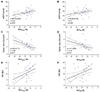
Baseline RVLS are listed in Table 1. RVLSglobal was -13.3±5.0% and RVLSFW was -15.1±5.8%. In patients with advanced clinical symptoms (NYHA functional class III/IV) had significantly decreased RVLSglobal (-17.1±6.1 vs. -11.4±3.1%, p=0.01). RVLSFW showed lower in the patients with advanced symptoms without statistical significance (-18.3±7.1 vs. -13.4±4.4%, p=0.08, Fig. 1). RVLSglobal showed good correlations with 6-minute walking distance (6MWD, r=-0.54, p<0.01) and logarithmic transformation of BNP concentration (LogBNP, r=0.65, p<0.01, Fig. 2A and C). Also, RVLSFW demonstrated significant correlations with 6MWD (r=-0.57, p<0.01) and LogBNP (r=0.65, p<0.01, Fig. 2B and D). RVLSglobal had significant correlations with hemodynamic parameters including mPAP (r=0.35, p<0.05), cardiac index (r=0.50, p<0.01, and PVR (r=-0.45, p=0.01, Fig. 3A, C, and E). RVLSFW showed similar correlation with cardiac index (r=-0.47, p<0.01) and PVR (r=0.45, p=0.01). However, it did not have a significant correlation with mPAP (r=0.31, p=0.08, Fig. 3B, D, and F).
Follow-up echocardiography and right heart catheterization
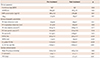
Follow-up RHC data were available in 25 patients with median time interval of two RHCs was 33 months (inter-quartile range=21-57 months). During the period, they were treated with additional specific pulmonary vasodilator therapy (19 with prostaglandin therapy, 3 with PDE5I, 1 with ERA, and 2 with combination of ERA and PDE5I). The follow-up clinical, echocardiographic and hemodynamic data are listed in Table 2. With specific pulmonary vasodilator treatment, clinical symptoms were improved, 6MWDs were increased and BNP levels were decreased. RV systolic function was improved, and mPAP and PVR were decreased. RVLSglobal and RVLSFW were increased significantly. Follow-up RVLSglobal value also showed significant correlation with follow-up 6MWD (r=-0.44, p=0.04) whereas RVLSFW showed insignificant correlation (r=-0.40, p=0.06). As baseline logBNP, follow-up logBNP revealed significant correlations with RVLSglobal (r=0.75, p<0.01) and RVLSFW (r=0.68, p<0.01).
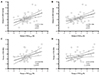
There were significant correlations between the change of mPAP and RVLSglobal (r=0.45, p<0.01) and RVLSFW (r=0.43, p<0.01, Fig. 4A and B). The change of PVR also had significant correlations with change of RVLSglobal (r=0.40, p=0.01) and RVLSFW (r=0.31, p<0.05, Fig. 4C and D).
No patient experienced deterioration of NYHA function class while on treatment. However, 5 patients had a worsening of 6MWD. In patients with worsening of 6MWD, RVLSglobal showed no significant change (from -13.5±3.8% to -13.9±4.7%, p=0.86). In patients with improvement of 6MWD, RVLSglobal improved from -12.7±5.8% to -16.0±5.2% (p=0.03). Interestingly, the RVFAC (a "conventional" marker of RV function) was significantly changed in both patient groups (in patients with worsening of 6MWD: from 20±4% to 26±4%, p=0.02; in patients with improvement in 6MWD: from 21±7% to 29±9%, p<0.01).
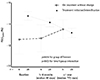
In our cohort, all patients underwent echocardiographic follow-up studies early (within 1 to 6 months, median 95 days) and late (>1 year, median 772 days). There were 6 patients without change of treatment after initial echocardiography and 28 patients with either treatment initiation or intensification (i.e., increase in dose or addition of another agent). Changes of RVLSglobal during follow-up are shown in Fig. 5. There was an improvement of RVLSglobal during follow-up in patients with change of medication (p=0.03 for the difference in slopes). Interestingly, while RVLSglobal was overall higher in the group without the change of medication (p=0.04), there was no additional change during follow-up.
Discussion
Baseline RVLS correlated with functional capacity and hemodynamic parameters in PAH patients. RVLS changed in parallel with the changes of invasively measured mPAP and PVR. Furthermore, echocardiographic follow-up data showed that changes in RVLS reflect changes in treatment during follow-up. This is relevant since, to our knowledge, there are no studies documenting the changes in RVLS during pulmonary hypertension treatment. These findings imply that, while single measurement of RVLS is prognostically relevant, it may be also necessary to track changes in treatment to appreciate its impact, and improve prognostication. Finally, when compared to previous studies,17)18) in this manuscript we correlate RVLS with measured, rather than estimated, RVSP and pulmonary vascular resistance. This finding is also relevant since a recent study19) showed that echocardiographic estimation may not be always accurate.
Although RV systolic dysfunction is an important prognostic factor in PAH patients, RV assessment can be challenging.20) RHC gives important pressure- and flow-derived parameters in the diagnosis and management of PAH patients.21) However, frequent serial measurement is invasive and impractical.22) CMR is a useful imaging method providing morphological and functional information of the RV.23)24) However, it is expensive, time consuming, and not readily available in most institutions, and may not be performed in some patients. Conventional 2DE remains the most common first-line imaging test in PAH patients. It provides several Doppler-derived parameters about right heart hemodynamics and some parameters; TAPSE or presence of pericardial effusion, are known as prognostic factors in PAH patients.20) However, the assessment of RV function parameters by standard 2DE often remains insufficient because of measurement variability intrinsic to the parameters measured.19)
Two-dimensional strain echocardiography is a new method providing relatively easy and angle-independent quantification of myocardial deformation on 2DE images.12) Because the predominant orientation of muscle fiber in the RV is in the longitudinal plane, longitudinal motion of RV is a major determinant of RV systolic function, especially in patients with PAH.7) Strain echocardiography can measure RVLS, and RVLS can give direct information about regional and global RV mechanics.
RV dysfunction is a well-known factor of functional impairment in PAH patients.25) Presently, patients with advanced symptoms had more decreased RVLS. Our result is similar to the previously reported studies showing PAH patients with worse RV longitudinal peak systolic strain had worse functional class and lower RV systolic function.12)26) Patients with poor exercise capacity (6MWD<332 m) have poor prognosis.20)27) RVLS significantly correlated with functional capacity assessed by 6MWD at baseline and follow-up in this study. After adjustment of age, gender, body mass index, cardiac index and mPAP, RVLSglobal (standardized β=-0.63, p<0.01) and RVLSRVFW (standardized β=-0.59, p<0.01) showed significant association with baseline 6MWD.
Increased PVR, as consequences of pathological changes in the pulmonary arteries, results in RV pressure overload and RV systolic dysfunction in PAH.25) Chronic RV pressure overload directly affect RV longitudinal systolic function and result in impairment of RVLS.17) Pirat et al.12) reported significantly impaired global and regional RV systolic function in 57 patients with PAH compared with age-matched normal controls. Sachdev et al.6) documented significantly decreased RV longitudinal peak systolic strain of RV free wall (-15±5%) in a cohort of 80 PAH patients. They showed that patients with impaired RV free wall strain (>-12.5%) had higher mPAP and PVR. In our study, mean RVLSglobal was -13.2±5.0% and RVLSFW was -15.1±5.8%, and these values are similarly decreased as in the study of Sachdev et al.6) We showed significant correlations of baseline RVLS with functional and hemodynamic parameters.
Recent development of pharmaceutical therapies has resulted in improved hemodynamics, exercise capacity, and prognosis in PAH patients.28) The effect of specific pulmonary vasodilator therapy on RVLS and their relationship with invasive hemodynamic parameters was also investigated. RVLS increase may be accompanied with decrease of mPAP and PVR after vasodilator treatment. Moreover, there are several reports regarding how impaired RVLS can be used as a prognostic markers in PAH patients.6)18)26) These results suggest that RVLS can be a useful non-invasive indicator in the serial assessment of RV systolic function in PAH patients.
Limitations
In this retrospective and observational study, major limitations include the relatively small numbers of PAH patients and the number of PAH patients who did not have repeat right heart catheterization. Bias may have been introduced from patient selection. We were not able to assess if RVLS provided long-term prognostic information. However, the improvement in 6MWD was associated with the improvement of RVLS. This result suggests that the assessment of RVLS may be useful to track clinical changes in PAH patients. We analyzed RVLS with stored images, and the analysis may have been affected by image quality and echocardiographic machines. Secondly, we used a vendor-independent platform to measure RVLS with echocardiographic images studied by different echocardiographic machines. However, using a vendor-independent platform from different echocardiographic machines can be an option in the comparison of RVLS in serial echocardiographic examinations, especially in the assessment of treatment effects. Echocardiographic parameters and cardiac catheterization were not performed simultaneously. The decision for a second catheterization was made on clinical grounds. There were no specific criteria for a second heart catheterization. Nonetheless, a prospective study with large numbers of patients using the same echocardiographic machine will be needed to confirm the correlations and the clinical impact of this measurement.
Conclusions
RVLS calculated by strain echocardiography correlates with functional capacity and invasive hemodynamic parameters in patients with PAH. The increase of RVLS corresponds with the decrease of mPAP and PVR with specific pulmonary vasodilator therapy. Decrease of mPAP and PVR as a result of treatment was associated with improvement of RVLS.
 XML Download