

 PDF
PDF ePub
ePub Citation
 Print
Print


Introduction
Although platelet activation and aggregation is an essential part of hemostasis, it also initiates acute coronary syndrome or thrombotic complications related to percutaneous coronary stent implantation. Dual antiplatelet therapy, including aspirin and P2Y12 inhibitors, is usually recommended in patients with acute myocardial infarction or unstable angina, especially those who have undergone percutaneous coronary intervention (PCI) with drug-eluting stents.1)2)3) One of the most commonly used P2Y12 inhibitors is clopidogrel, which needs to be metabolized in vivo to become an active drug. However, individual response to oral clopidogrel to inhibit P2Y12 receptor is variable,4)5) and, despite taking clopidogrel, high residual platelet reactivity in patients with PCI has been associated with death, myocardial infarction, or stent thrombosis.6)
Platelet function tests such as light transmission aggregometry (LTA), VerifyNow P2Y12 assay, platelet function analyser, or flow cytometric analysis of vasodilator-stimulated phosphoprotein (VASP) phosphorylation or P-selectin are used to measure on-treatment high residual platelet reactivity;4)5)6)7)8)9) however, no single test can evaluate the complex mechanisms of platelet activation and aggregation.4) In patients undergoing coronary stent implantation, the diagnostic accuracy of each test to predict cardiovascular events was not high.10)
Activation and prothrombin binding of platelet glycoprotein (GP) IIb/IIIa is a final common pathway of platelet aggregation.11)12) If the reactivity of platelet GP IIb/IIIa is directly measured, it would be a more accurate assay to evaluate the residual platelet reactivity. PAC1, a monoclonal antibody having high affinity to activated platelet GP IIb/IIIa,13)14)15) was used to monitor the effect of GP IIb/IIIa antagonists on platelet activation.16)17)18) However, the direct measurement of GP IIb/IIIa activation with PAC1 to assess the residual platelet reactivity in patients taking clopidogrel has not yet been systemically performed. Feasibility of flow cytometric analysis using PAC1 in whole blood to measure on-treatment residual platelet reactivity was investigated in this study.
Subjects and Methods
Study patients
A total of 27 patients with coronary artery disease, who were taking clopidogrel 75 mg per day for at least 7 days, or for at least 48 hours after the 300-600 mg loading dose, were included in this study, after acquiring their written informed consent. The study protocol was approved by the institutional review board of Jeju National University Hospital.
Reagents
Sodium chloride (NaCl; Prod. No. S3014), potassium chloride (KCl; Prod. No. P9541), magnesium chloride (MgCl2; Prod. No. M8266), dextrose (Prod. No. D9434), bovine serum albumin (BSA; Prod. No. A2513), 4-(2-hydroxyethyl)-1-piperazineethane-sulfonic acid (HEPES; Prod. No. H3375), paraformaldehyde (Prod. No. P6148), adenosine 5'-diphosphate (ADP; Prod. No. A2754), and prostaglandin I2 (PGI2; Prod. No. P6188) were purchased from Sigma Chemical Co. (St. Louis, MO, USA). Monoclonal antibodies, fluorescein isothiocyanate (FITC)-conjugated PAC1 (Cat. No. 340507) and FITC-conjugated mouse IgM, κ isotype (Cat. No. 555583), were from Becton Dickinson Co. (San Jose, CA, USA). PE-conjugated anti-CD41 (Prod. No. R7058), and phycoerythrine (PE)-conjugated mouse IgG1 (Prod. No. X0928) were from DAKO Co. (Glostrup, Denmark).
Blood sampling
Whole blood was withdrawn in the morning, from an antecubital vein using a 21-gauge needle. After discarding the first 2 mL, the blood was collected into a sodium citrate-coated tube, and was processed within 30 minutes of collection.
VerifyNow P2Y12 assay
Whole blood was processed according to the user's manual of VerifyNow system (Accumetrics, San Diego, CA, USA). P2Y12 reaction unit (PRU), measured in ADP/PGE1 channel, reports ADP-medicated aggregation specific to P2Y12 receptor. BASE is an independent measurement based on platelet aggregation from thrombin receptors, and protease activated receptors (PAR) PAR-1 and PAR-4. Percent inhibition (%) was the percent change from baseline aggregation, and was calculated from PRU and BASE using the following equation: % inhibition=(BASE-PRU) × 100/BASE.
Flow cytometry
In a mixture consisting of 5 µL of ADP and 25 µL of isotonic HEPES buffer (137 mM NaCl, 2.7 mM KCl, 1 mM MgCl2, 5.6 mM dextrose, 1 mg/mL BSA, 20 mM HEPES, pH 7.4), 15 µL FITC-conjugated PAC1 (final concentration 60 µg/mL) was incubated for 15 minutes with 5 µL of whole blood. Total volume of the reaction mixture was 50 µL, and the final concentration of ADP was either 1, 10, or 20 µM. To measure the baseline activation of GP IIb/IIIa at ADP 0 µM, 1 µM PGI2 was added instead of ADP. FITC-conjugated mouse IgM, κ isotype (IgMκ), was used as a control antibody. For staining of the total active and inactive GP IIb/IIIa, 5 µL of whole blood was incubated for 15 minutes with 10 µL of PE-conjugated anti-CD41, 5 µL of PGI2 (final concentration 1 µM), and 30 µL of isotonic HEPES buffer. The reaction was stopped by adding 500 µL of HEPES buffer. After fixation with 500 µL of 1% paraformaldehyde, the samples were stored at 4℃ in the dark, until flow cytometric analysis.
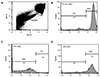
Flow cytometric analysis was performed with BD FACSCalibur (San Jose, CA, USA). Platelets were distinguished from erythrocytes and white blood cells as described by Shattil et al.14) Briefly, platelets were separated in whole blood by their characteristic forward- and side-scatter profiles. A gate was set around the platelets, and 10000 cells were analyzed to quantify the amount of platelet-bound FITC-PAC1 (Fig. 1A). Over 90% of cells in this gate were platelets identified by PE-anti-CD41 (Fig. 1B). The FITC-PAC1 binding was expressed as mean fluorescence intensity (MFI), percentage of positive platelets for antibody (%PP), or binding index (BI). Antibody-positive platelets were defined as those having a fluorescence intensity >99.0% to 99.5% of non-stimulated platelets stained with FITC-conjugated mouse IgMκ (Fig. 1C and D).14) Binding index was calculated as MFI×%PP/100.
Statistics
Values are expressed as mean±standard deviation or, where appropriate, mean±standard error of mean. Changes of MFI, %PP or binding index after stimulation with increasing concentration of ADP, were compared by paired t-test. Correlations between variables were evaluated by Pearson's correlation. Values were considered to be statistically significant, when p<0.05. All statistical analyses were performed using SPSS for window version 12 (SPSS Inc. Chicago, IL, USA).
Results
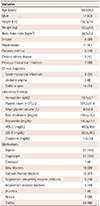
Baseline characteristics of patients are shown in Table 1. Mean age was 65.4±9.0 years. Clinical diagnoses were acute myocardial infarction in 6 patients, unstable angina in 2 patients, and stable angina in 19 patients. Platelet count was 197.2±51.4×10³/µL, and mean platelet volume was 9.9±0.8 fL. All patients were on aspirin and clopidogrel treatment.
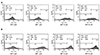
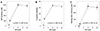
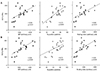
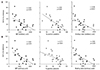
Examples of flow cytometric data and analysis are demonstrated in Fig. 2. In a patient with low residual platelet reactivity (PRU 101 and % inhibition 48%), the MFI, %PP, and binding index were 607, 57%, and 347 respectively, after ADP stimulation at 20 µM (Fig. 2A). In contrast, a patient with high residual platelet reactivity (PRU 297 and % inhibition 19%) showed much greater MFI, %PP, and binding index at 20 µM of ADP (2235, 88%, and 1959, respectively) (Fig. 2B). MFI, %PP, and binding index increased after ADP stimulation in a dose-dependent manner, and reached maximal values at 10 µM concentration (Fig. 3). MFI, %PP, or binding index correlated significantly with VerifyNow PRU at 10 µM (r=0.59, 0.73, and 0.60 respectively, all p<0.005) and 20 µM of ADP (r=0.61, 0.75, and 0.63 respectively, all p<0.005) (Fig. 4). There were also significant correlations between P2Y12 % inhibition and MFI, %PP, or binding index after ADP stimulation at 10 µM (r=-0.60, -0.69, and -0.59 respectively, all p<0.005) and 20 µM (r=-0.63, -0.71, and -0.62 respectively, all p<0.005) (Fig. 5).
Discussion
This study showed that a direct measurement of the reactivity of platelet GP IIb/IIIa using PAC1 and flow cytometry was possible to assess on-treatment residual platelet reactivity in patients taking clopidogrel. The MFI, %PP, or BI of this assay had a significant correlation with PRU or % inhibition of VerifyNow assay.
GP IIb/IIIa is the most abundant receptor among all the platelet membrane proteins. The most important characteristic of GP IIb/IIIa is its affinity modulation of binding to fibrinogen, the main ligand involved in platelet aggregation. Low affinity state for fibrinogen binding in resting platelets becomes high affinity state after activation by agonists, such as ADP, thrombin or arachidonic acid.11)12) PAC1, which binds to the activated form of GP IIb/IIIa but not to the resting platelets,13)14)15) is a suitable murine monoclonal antibody for evaluating platelet reactivity. In this study, PAC1-binding to platelets was very low in resting platelets, but increased dramatically after ADP stimulation, especially in on-treatment patients with high residual platelet reactivity.
Several clinical tests are used to measure the residual platelet reactivity in patients taking clopidogrel. LTA is a historical gold standard test which measures the change of turbidity after platelets aggregate by agonist-stimulation. Although LTA is the most widely used method to monitor the effects of antiplatelet agents and predict clinical outcomes, it requires large sample volumes, immediate separation of platelet-rich and platelet-poor plasma from whole blood, lengthy processing time, and a trained technician, all of which result in variable reproducibility, making it difficult for a point-of-care method in daily clinical situations.4)7) Presently, VerifyNow P2Y12 assay has been the most commonly used point-of-care system to measure the residual platelet reactivity in clinical studies. Because it does not need the separation of platelet-rich plasma, and it correlated with ADP-stimulated platelet aggregation by LTA,4) high PRU has been the most frequently used criteria in many clinical studies of patients with coronary stents to predict clinical outcomes.6)9)19) However, diagnostic accuracy of high platelet reactivity during on-treatment, defined by PRU ≥236 to predict 1-year clinical outcomes, was only 13% in patients undergoing elective coronary stent implantation and taking clopidogrel.10) In Gauging Responsiveness with A VerifyNow assay-Impact on Thrombosis And Safety (GRAVITAS) trial, PRU-guided high-dose clopidogrel therapy among patients with high on-treatment platelet reactivity (PRU≥230) after PCI with drug-eluting stents, did not reduce fatalities from cardiovascular causes, non-fatal myocardial infarction, or stent thrombosis, when compared with standard-dose clopidogrel.20)
Flow cytometry is also a valuable tool to evaluate platelet reactivity. P-selectin expression on platelet surface, or platelet-leukocyte aggregate, was monitored by flow cytometry to evaluate the inhibitory effect of clopidogrel.8)21) Flow cytometric assessment of VASP phosphorylation, which measures activation-dependent intracellular signaling of P2Y12 receptor, has been frequently used to differentiate high on-treatment platelet reactivity.19)22) The activated state of platelet GP IIb/IIIa was evaluated to monitor the treatment effect of GP IIb/IIIa antagonists.16)17)18)
In patients taking clopidogrel, direct measurement of platelet GP IIb/IIIa activation by ADP may be a more valuable tool to monitor the residual platelet reactivity. In this study, activation of GP IIb/IIIa detected by flow cytometric analysis of PAC1-binding to platelets correlated significantly with both PRU and % inhibition of VerifyNow P2Y12 assay, especially at ADP 20 µM, which was the same concentration included in ADP channel of the VerifyNow system. Although flow cytometry was calibrated every day before sample running, MFI might be influenced by variations during staining process of fluorescent PAC1 with platelets. PAC1-binding platelets were defined as those with fluorescence intensity >99.0% to 99.5% of non-stimulated platelets, processed in the presence of 1 µM PGI2. This index (%PP), is relatively independent on daily sample processing and measurement, and may be more accurate than MFI. Notwithstanding, MFI as well as %PP showed good correlations with PRU or % inhibition of VerifyNow system, which suggests both indices can be used to measure the reactivity of GP IIb/IIIa.
Although whole blood flow cytometry has advantages such as low sample volume or the non-requirement of centrifugation or washing, it also has several drawbacks.4)7) It needs expensive flow cytometric analysis and experienced staff. Clear separation of platelets from erythrocytes and white blood cells is an essential requirement in flow cytometric analysis of whole blood. Platelets in whole blood could easily be discriminated by their characteristic small forward- and side-scatter profiles. The two-color method may more accurately separate platelets in whole blood. However, considering that an earlier study showed similar flow cytometric results when either one-color or two-color method was used,14) and since the one-color method (which is also used in VASP phosporylation assay)23) is more easily applicable considering the cost or processing time, in the present study the platelets were distinguished in the whole blood without a second antibody staining. Over 90% of cells in the platelet gate were platelets, as confirmed by anti-CD41, a monoclonal antibody against GP IIb. A time delay during PAC1 staining and fixation may lead to spontaneous activation of the platelets.13) To minimize it, whole blood was processed within 30 minutes after sampling from the body; it was not difficult to maintain this sample processing time if all the reagents were ready in a tube before blood sampling.
This study has several limitations. First, cut-off values to define high on-treatment residual platelet reactivity could not be determined due to the small number of patients. A further clinical study to determine an optimal cut-off point is needed. Second, this assay may be expensive because it requires costly monoclonal antibodies and flow cytometry. However, the total cost of this method at our institute was comparable to that of VerifyNow assay, and VASP phosphorylation assay using flow cytometry is frequently used in clinical studies. Third, a need for sample processing without any uncertainty by an experienced staff may make it difficult for it to be used as a point-of-care assay.
In conclusion, direct measurements of the reactivity of platelet GP IIb/IIIa were feasible using PAC1 and flow cytometry. Cut-off values of this assay to define high on-treatment residual platelet reactivity need to be determined in a further clinical study.
 XML Download