

 PDF
PDF ePub
ePub Citation
 Print
Print


Introduction
The red blood cell distribution width (RDW), part of the standard complete blood count, is a measure of the variability in circulating erythrocyte size that is often used in the differential diagnosis of anaemia.1) Recently, the RDW was found to be associated with a poor prognosis and increased mortality rate in several cardiovascular diseases such as stable coronary heart disease,2) heart failure,3) and peripheral artery disease,4) and also with some invasive cardiac procedures such as primary coronary intervention5) and transcatheter aortic valve implantation.6) The RDW is also elevated in some subclinical states of atherosclerosis, e.g., in patients with microalbuminuria, which is an independent predictor of cardiovascular (CV) events.7) Computerized tomography (CT) can be used to calculate the coronary artery calcification score (CACS), which is a measure of the plaque burden in the coronary arteries. The severity of coronary artery calcification (CAC) has been found to be a useful marker of atherosclerosis,8) and is an independent predictor of CV events.9) Although the relationship between the RDW and CV disease (CVD) is well-documented in the literature, there are limited data concerning the relationship between haematological parameters and the CACS.10) The goal of this study was to determine whether serum RDW measures are associated with the CACS in patients with a low to intermediate risk for coronary heart disease (CHD) but without known CHD.
Subjects and Methods
Study population
We enrolled 527 consecutive outpatients who had no exclusion criteria and no obvious CHD, but who were found to have a low to intermediate risk for CHD based on their Framingham risk score (FRS) as described by Wilson et al.11)
Patients were excluded from the study if they had evidence of coronary artery or cerebrovascular disease, heart failure, renal or hepatic dysfunction, a history of cancer, systemic inflammatory disease, autoimmune disease, any haematological system disorder, thyroid disease, or a recent infection (within the previous three months). Baseline characteristics of patients, including age, sex, presence of hypertension (HT) and/or diabetes mellitus (DM), smoking status, left ventricular ejection fraction, FRS, complete blood count parameters, uric acid, fasting serum lipid levels, and C-reactive protein levels were recorded and compared according to the CACS. All of the patients underwent coronary CT angiography and the CACS was calculated.
The study protocols were approved by the local ethics committee, and they complied with the Declaration of Helsinki.
Laboratory tests
Venous blood samples were obtained following a 12-hour fasting period and used in all laboratory tests. The lipid profile in each patient was measured by standard methods. Haematological indices were measured using an automated blood cell counter (Beckman Coulter HmX AL Haematology Analyzer, Brea, CA, USA).
Coronary computerized tomography angiography
All CT scans were performed using a 64-slice scanner (Philips Brilliance 64, Philips Medical Systems, Eindhoven, Netherlands) with a 0.42-second rotation time with a pitch of 0.2, a tube voltage of 120 kVp, and a tube current of 600-1050 mAs. Patients with heart rates >70 beats/minute were treated with metoprolol intravenously (5 to 15 mg) or orally (100 mg) one hour before the scan unless they had any known contraindications for beta-blocker usage. All data sets were reconstructed using retrospective electrocardiographic gating at 40%, 75%, and 80% of the inter-beat (RR) interval. Data sets were reconstructed using a dedicated workstation (EBW, Philips Medical Systems, Highland Heights, OH, USA). The calcium score for each artery was calculated as the sum of calcium scores in the left main, left anterior descending, left circumflex, and right coronary arteries according to the Agatston method.12)
Statistical analysis
The SPSS 20.0 software package (SSPS, Inc., Chicago, IL, USA) was used for statistical analyses. Continuous variables were expressed as means±standard deviation if they were normally distributed, or as medians with interquartile ranges if they were not normally distributed. Categorical variables were expressed as total number (percentage). All continuous variables were checked with the Kolmogorov-Smirnov normality test to assess their distribution pattern. Normally distributed variables were compared using the unpaired Student t test and analysis of variance (ANOVA), while abnormally distributed variables were compared using the Mann-Whitney U test and ANOVA. For categorical variables, the chi-square test was used. Pearson and Spearman correlation coefficients were used to calculate univariate correlations. Multiple linear regression analysis with forward stepwise selection was performed to identify factors independently associated with the CACS. Receiver-operating characteristic (ROC) curves for RDW values were used to determine the optimal cut-off values in order to predict the severity of CAC and to establish the optimal cut-off points for use in clinical decision-making. A p value <0.05 was considered statistically significant.
Results
A total of 527 consecutive patients were enrolled in this study. The median age of patients was 56 years (range; 34-81 years), and 380 (72.1%) patients were males.
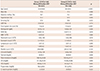
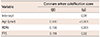
On the basis of the CACS, patients were divided into two groups: Group I (CACS≤100) and Group II (CACS>100). Table 1 summarizes the demographic, clinical, and laboratory data of the two groups. The mean age of Group I patients was significantly lower than the mean age of Group II patients {55.0 years (range, 34-73 years) vs. 58.5 years (range, 48-81 years), p<0.001}. The rates of DM and HT were significantly higher in Group II than in Group I (15.1% vs. 10.7%, p=0.001 and 67.0% vs. 51.3%, p=0.006, respectively).
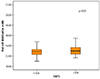
Compared with Group I patients, Group II patients had significantly higher FRS (11.9±6.2 vs. 7.4±5.6, p<0.001), haemoglobin (14.80±1.47 vs.14.71±1.51, p=0.03), RDW {12.97 (1.1) vs. 12.80 (1.0), p=0.01}, neutrophil count (1.82±0.98 vs. 1.60±1.08, p=0.01), and neutrophil/lymphocyte ratio (NLR) {1.54 (1.0) vs. 1.39 (0.6), p=0.008}. The between-group differences in RDW and NLR are shown in Fig. 1.
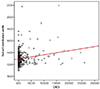
The bivariate correlation analysis revealed that the CACS was positively correlated with patient age (r=0.386, p<0.001), HT (r=0.227, p<0.001), DM (r=0.148, p=0.007), FRS (r=0.271, p<0.001), and RDW (r=0.202, p<0.001) (Fig. 2), and it was inversely correlated with the ejection fraction (r=-0.122, p=0.01).
The results of multivariate analysis showed that patient age (β=0.300, p<0.001), RDW (β=0.156, p=0.001), and FRS (β=0.119, p=0.02) were significant independent predictors of the CACS (Table 2).
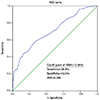
Using the ROC curve analysis, an RDW value of 13.05% was identified as an effective cut-off point for predicting the severity of the CACS (>100), with a sensitivity of 58.9% and a specificity of 72.0%, and the area under the curve (AUC) was 0.706 (Fig. 3).
Discussion
The present study demonstrated that a CACS greater than 100 is associated with higher patient age, DM, HT, FRS, Hb, RDW, neutrophil count, and NLR. In addition, the patient age, RDW, and FRS were found to be independent predictors of the CACS. An RDW value of 13.05% was identified as an effective cut-off point for predicting the severity of the CACS (>100) with a sensitivity of 58.9% and a specificity of 72.0% (AUC=0.706).
The association between the presence of CAC and the risk of cardiovascular events has been established for several years.13) In addition to the traditional risk factors,14)15) the CACS has prognostic value in asymptomatic patients and may have an incremental benefit for use by physicians. The presence of calcium is correlated with the degree of plaque burden. Detrano et al.16) compared participants with scores above 100 and 300 with participants with no coronary calcium, and found increased coronary events in the higher scoring groups.12) Similar to their study, we also consider that a CACS of above 100 is associated with high risk.
The relationships between the CACS and classical cardiovascular risk factors such as patient age, DM, and HT are well known.17)18) Atherosclerosis is a disease of aging,19) specifically, a state of premature vascular aging that has been related to reduced cell proliferation, irreversible growth arrest and apoptosis, elevated DNA damage, epigenetic modifications, cellular senescence, and telomere shortening.20) Our results support the idea that aging is directly responsible for the development of atherosclerosis. According to a review of the literature by Sunkara et al.18) use of the CACS is a very useful risk stratification technique, primarily for diabetics and patients with metabolic syndrome. Because the CACS is a predictor of atherosclerosis, in our study, as expected, the FRS was found to be elevated in patients with a higher CACS.
As part of an extensively used basic haematological test, the RDW has become a target of investigation after it was found to be a surprisingly strong independent predictor of morbidity and mortality rate in heart failure patients.3) Karabulut et al.5) reported that an elevated RDW level on admission is associated with poorer reperfusion in patients with AMI treated with a primary coronary intervention. Lappe et al.2) found an increase in patient mortality rates with increased RDW levels in their study, including CHD patients who do not have heart failure. Stroke occurrence, CV-related and all-cause mortality were also found to be related to an elevated RDW.21) Another recent study documented that an increased baseline RDW level and an accelerated increase of the RDW in patients with transcatheter aortic valve implantation were associated with a poorer prognosis and increased mortality rate during a median follow-up period of 12 months.6)
Afonso et al.7) emphasized that the RDW is found to be elevated in patients with microalbuminuria. Our earlier study also included patients with another subclinical state of CVD who are free of obvious CHD but who have a low to intermediate risk of developing CHD in the next 10 years.11) We demonstrated a significant relationship between the RDW and the CACS. There are conflicting data in the literature regarding this issue. In contrast to our study, Chaikriangkrai et al.10) found no association between the complete blood cell count, including the RDW, and the CACS in 868 patients without known CHD.
Some studies have linked an increased RDW with inflammatory markers such as high-sensitivity C-reactive protein, soluble tumour necrosis factor receptors, and IL-6 in the setting of atherosclerosis.22)23)24) There is a relationship between inflammation and oxidative stress through activation of nuclear factor-κB via reactive oxygen species.15)25)26) Recently it was shown that recurrent haemorrhages originating from fragile neomicrovessels bleed into the core of unstable plaques.27) This could cause a decline in haemoglobin levels, although this has not yet been demonstrated in the literature. In the present study, however, the haemoglobin level was increased, not decreased, in the higher CACS group. This may be because our patient population, which did not have obvious CHD, probably had more stable plaques. In contrast to our study, Chaikriangkrai et al.10) demonstrated that haemoglobin levels, like all the other haematological parameters, were not related to the CACS.
The NLR is simple to calculate, inexpensive, and is emerging as a potential new biomarker of inflammation related to various inflammatory and neoplastic diseases.19) It could also be used to identify individuals at risk for future CVD events.20) Park et al.28) demonstrated that a higher NLR is associated with the CACS and arterial stiffness. An increased neutrophil and/or a decreased lymphocyte count may contribute to the increased NLR in atherosclerosis.29)30) In the current study, the neutrophil count was higher in patients with a CACS >100, without a significant difference in the lymphocyte count, thus resulting in a higher NLR value in patients with a higher CACS.
In conclusion, the results of the present study show that an elevated RDW is associated with a higher CACS, which reflects the atherosclerotic burden in the coronary arteries. A high NLR correlated with a high CACS, as assessed by coronary CT angiography in patients who had a low to intermediate risk for CHD; and the RDW and patient age were found to be independent predictors of the CACS. Additional studies are needed to clarify the predictive value of RDW and NLR in subclinical CHD patients.
 XML Download