Journal List > Korean Circ J > v.45(5) > 1017261

Kaul: Assessment of Myocardial Collateral Blood Flow with Contrast Echocardiography

Abstract

Humans have pre-formed collateral vessels that enlarge with ischemia. In addition, new vessels can be formed within ischemic zones from pre-formed endocardial arcades of vessels providing rich collateral flow. Collateral flow under resting conditions (if >25% of normal) is enough to maintain myocardial viability, but may be insufficient to prevent myocardial ischemia under stress. Coronary angiography is a poor tool for collateral flow assessment. Myocardial contrast echocardiography is arguably the gold standard for experimental and clinical measurement of collateral flow. This review describes several experimental and clinical studies that highlight the importance of the collateral circulation in coronary artery disease.

Background

Coronary collaterals were first described in 1669 by Richard Lower.1) However, our understanding of the anatomy and physiology of the coronary collaterals in humans rapidly increased with the development of high-resolution post-mortem angiography. Pioneering studies by anatomists such as Kugel, Fulton and Baroldi provided us with detailed anatomy of the coronary circulation along with its collateral branches.2)3)4) In the mid 1970's, Wolfgang Schaper and his colleagues initiated work on factors that lead to collateral development and continued to make important contributions for 40 years.5) Michael Cohen6) published a comprehensive book on the subject in 1985. Accurate experimental and clinical non-invasive evaluation of collateral blood flow began in the 1980's with the introduction of myocardial contrast echocardiography (MCE), a non-invasive method of measuring myocardial blood flow.7)8) Earlier attempts at non-invasive measurement of collateral blood flow with Argon and Xenon were not that successful.
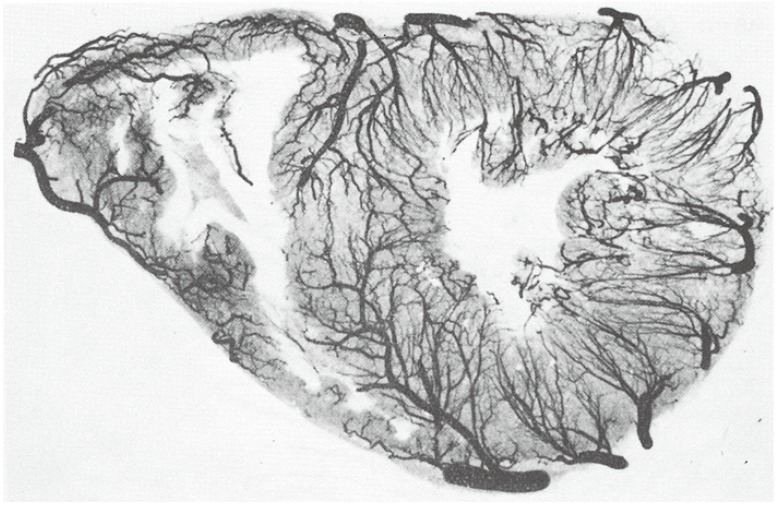
While this article mainly discusses the assessment of collateral blood flow using MCE, some important basic premises are first presented. As shown in Fig. 1, normal humans have pre-formed coronary collaterals.2) Furthermore, the penetrating arterioles that end in the subendocardium connect with each other to form an arcade that can allow development of new vessels. As a result, in chronic coronary artery disease (CAD), pre-formed collateral vessels enlarge and new collateral vessels develop into the ischemic zone such that when a major artery becomes occluded, the myocardium can even escape necrosis, as shown in Fig. 2.3) Most of these collateral vessels are intra-myocardial and less than 100 µm in diameter and, therefore, cannot be visualized on routine clinical coronary angiography.6)
The misconception that pre-existing collaterals do not exist in humans resulted from the use of coronary angiography that can neither resolve small vessels nor measure blood flow. Visualization of the collateral vessels requires a pressure gradient between the feeding and receiving vessels that occurs only when an artery is completely, or almost occluded. Transient occlusion of a feeding artery with a balloon during contrast injection can immediately light up collateral vessels that are otherwise unseen. Interestingly, there is very poor correlation between the presence and size of angiographic collaterals and actual perfusion within the collateralized zone.9)10)

Myocardial Contrast Echocardiography (Intracoronary Injection)

MCE facilitates easy visualization of collateralized zones within regions supplied by occluded vessels and subsequent quantification of myocardial collateral blood flow and prediction of myocardial viability during acute myocardial infarction. MCE was initially performed in experimental and cardiac catheterization laboratories by sonication of radio-opaque contrast media and injection of this microbubble containing solution directly into the coronary artery. These early studies indicated that the method and site of injection of microbubbles influence the size of the perfusion bed.
When microbubbles are injected directly into an artery at the site of an occlusion, the perfusion bed size opacified by the microbubbles is larger than the non-opacified myocardium when microbubbles are injected into the left atrium. The latter is the actual risk area since it is also defined by collateral perfusion at the border zones.11) The flow down a coronary artery defines the perfusion bed size, if the microbubbles are injected at the same rate as the coronary flow rate without transient increase of coronary bed pressure by the injection itself. Very low flow rates reduce the perfusion bed size by as much as half indicative of the importance of collateral flow, since the border zones are supplied by collateral flow from adjacent vessels.12) Similarly, increasing flow and pressure down an artery increases the perfusion bed size by transferring flow through collaterals.12) Thus, collaterals play an important role in defining the highly dynamic risk area and perfusion bed sizes.
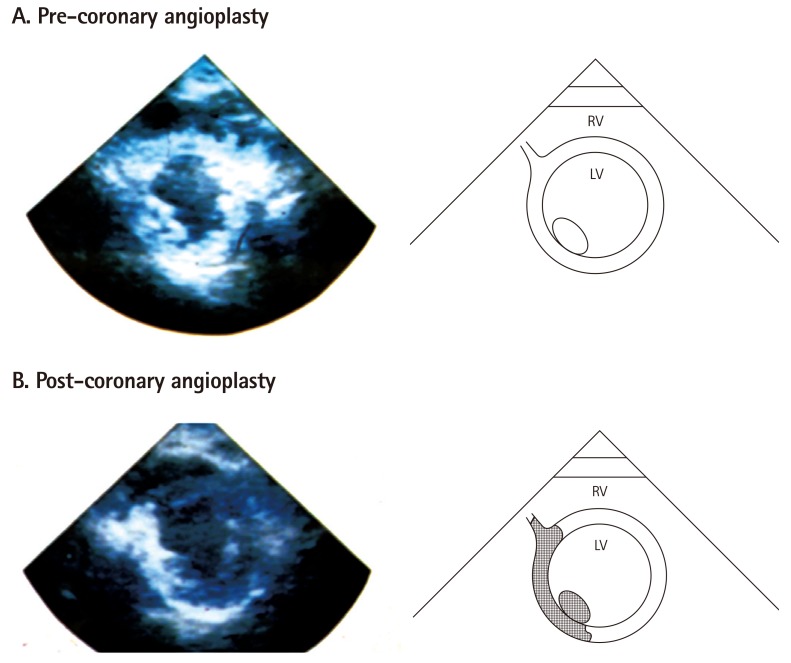
Collateral perfusion by MCE in humans was first reported in asymptomatic patients with recent (days to weeks) myocardial infarction who were referred to a tertiary care center for coronary angiography.9)10) The top panel in Fig. 3 is an example of a patient with an inferior infarction. Adequate myocardial perfusion in the entire myocardium after left main injection of microbubbles despite an occluded right coronary artery is indicative of collateral blood flow within the right coronary arterial bed. Coronary angiography shows no left to right collateral vessels. Angioplasty of the occluded right coronary artery is followed by direct injection of microbubbles (bottom panel of Fig. 3), to define the perfusion bed size of the artery. In this study, patients with adequate myocardial collateral perfusion (defined as >50% of the perfusion bed size of the occluded artery) showed recovery in function, as compared to those with poor collaterals or completely occluded artery. Similar results have also been demonstrated in patients with chronically occluded coronary arteries.14)

Myocardial Contrast Echocardiography (Intravenous Administration)

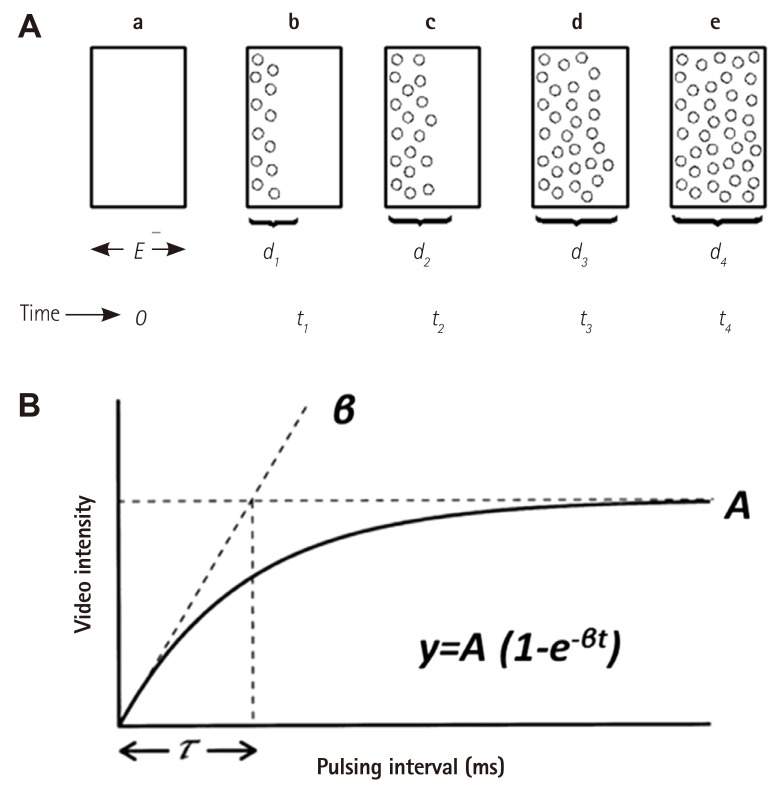
With the advent of commercially available microbubbles, we are able to perform MCE by intravenous administration of contrast material. The bubbles have a mean diameter of <4-5µm and behave like erythrocytes within the microcirculation.15)16) They are administered as a continuous intravenous infusion. When steady state is achieved after a few minutes, the ultrasound energy is increased so that the bubbles are destroyed in tissue.17) The rate at which they replenish tissue represents the mean microbubble or erythrocyte velocity.18) When the tissue is fully replenished, the backscatter represents tissue blood volume (Fig. 4).19) Since the left ventricular (LV) cavity contains only blood, the signal normalized to the LV cavity reflects the blood volume fraction of the tissue. The mean velocity multiplied by the blood volume fraction is a measure of flow per tissue volume that can be converted to mL·min-1·g-1 by normalizing to the specific gravity of tissue.
The average ultrasound beam thickness is 4-5 mm. At rest, the mean erythrocyte velocity in the myocardial capillaries is ≈1 mm·s-1·20) Consequently, it takes ≈4-5 s to replenish normal myocardium after bubble destruction (Fig. 4). If the flow is slower or faster, the myocardium fills slower or faster accordingly. Thus, a simple semi-quantitative interpretation of bubble replenishment times provides a rough estimate of normal or abnormal flow. When assessing collateral flow, the duration of imaging needs to be increased so as to allow replenishment of tissue at low flow rates.21)
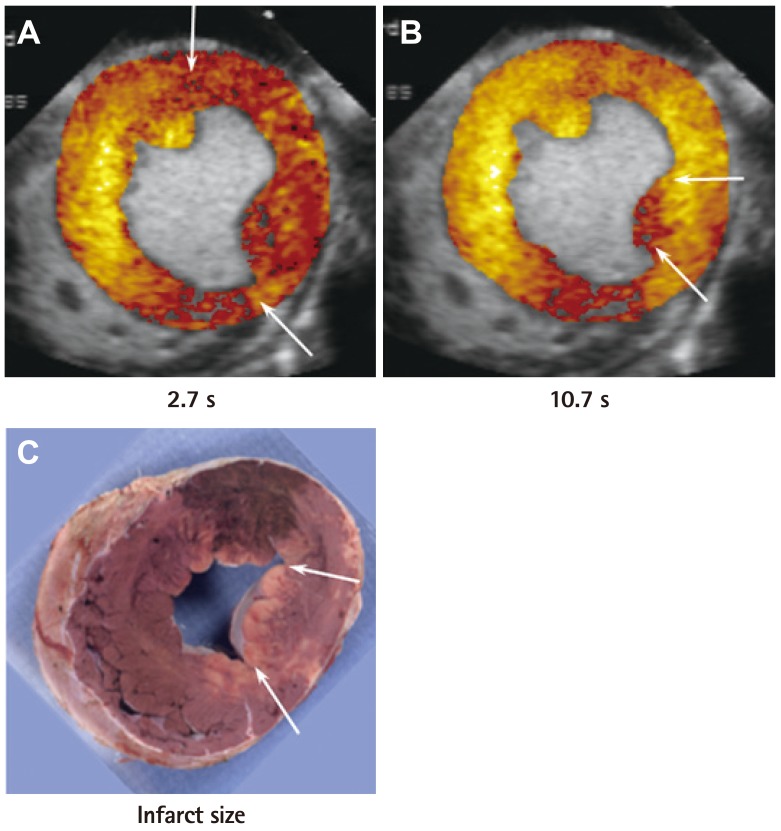
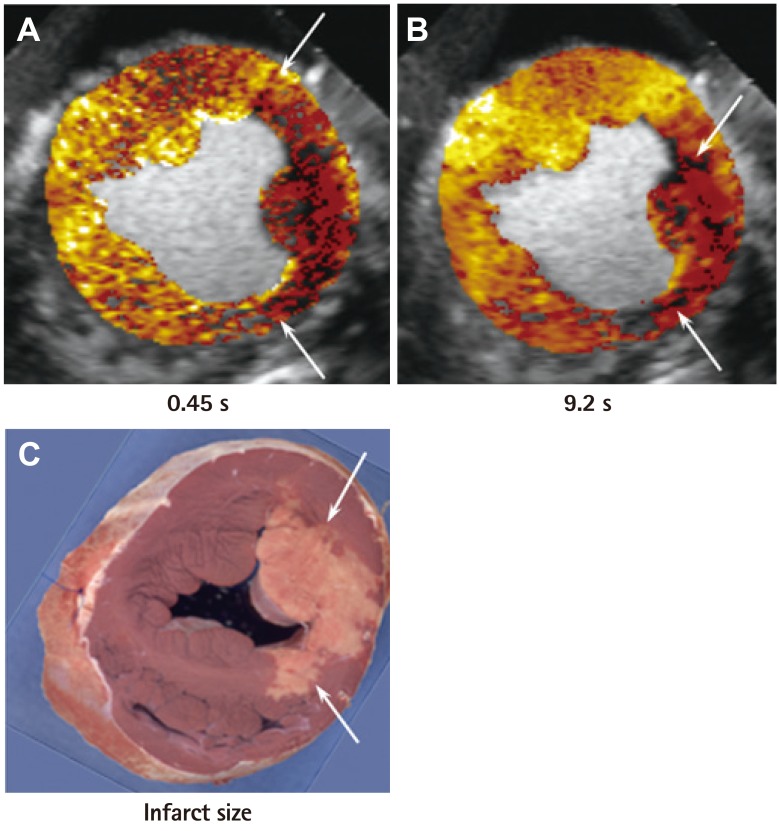
Fig. 5 and 6 are examples of collateral flow in a canine model of acute left circumflex artery coronary occlusion with continuous infusion of microbubbles.21) Images are acquired at specific time points after microbubble destruction, once steady-state is achieved. In Fig. 5, risk area is large as noted at 2.7 s after bubble destruction (Fig. 5A), but at 10.7 s most of it is opacified with no enhancement at the tip of the posteromedial papillary muscle alone (Fig. 5B). Post-mortem examination 6 hours later shows necrosis of the tip of the papillary muscle alone (Fig. 5C). In comparison, Fig. 6 shows that while the risk area at 0.45 s after bubble destruction is also large (Fig. 6A), most of it (except a tongue like projection) remains non-opacified even 9.2 s after bubble destruction (Fig. 6B). Post-mortem examination 6 hours later shows necrosis of the non-opacified myocardium (Fig. 6C). These examples suggest that based on the extent of collateral perfusion at the time of coronary occlusion, infarct size can be predicted even 6 hours later if the artery is not opened. Therefore, the decision to revascularize immediately or not can occur at the time of occlusion.

Role of Collateral Flow in Regional Flow-Function Relations

An apparent disparity between the circumferential extent of abnormal wall thickening versus that of infarction has emerged over the years; the extent of abnormal wall thickening is larger than that of the infarction.22)23)24) The explanations have ranged from mechanical tethering to inherent errors in the various methods of regional function analysis.25)26) This disparity is now attributed to low flow in the region adjacent to the infarcted zone.27) While collateral-derived flow in the region adjacent to the infarction is sufficient to prevent infarction, it is lower than normal with consequently reduced function.
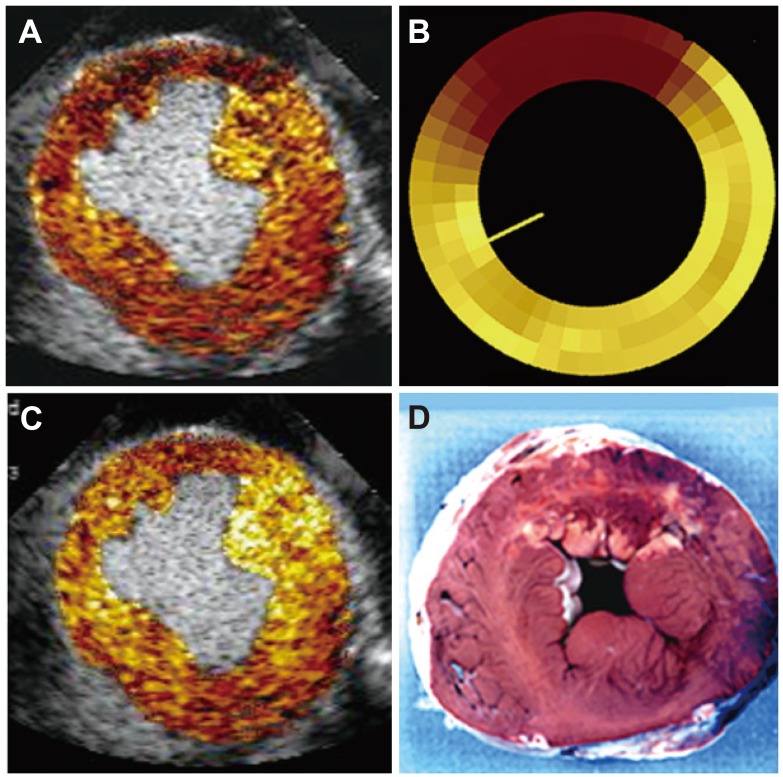
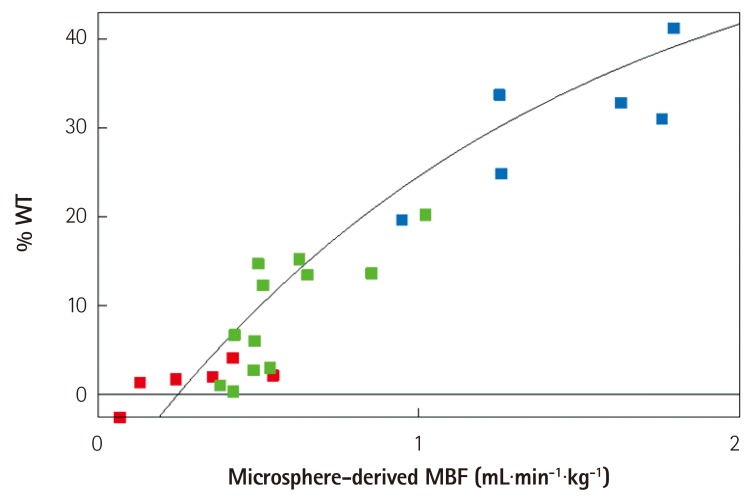
Fig. 7 is an example of a perfusion defect on MCE (Fig. 7A) that corresponds in size to that using radiolabeled microspheres, which is the gold standard for quantification of nutrient blood flow (Fig. 7B). The infarct size on post-mortem examination is much smaller (Fig. 7D) because of extensive collateral blood flow, as seen in a MCE image late after microbubble destruction (Fig. 7C). Fig. 8 depicts the flow-function relation where the red dots represent infarcted tissue, the blue dots represent normal remote tissue and the green dots represent the collateral-supplied zones on the infarct margins. All data points fall on the same line, indicating that there is no tethering; but functional disparities are explained solely by disparities in flow.
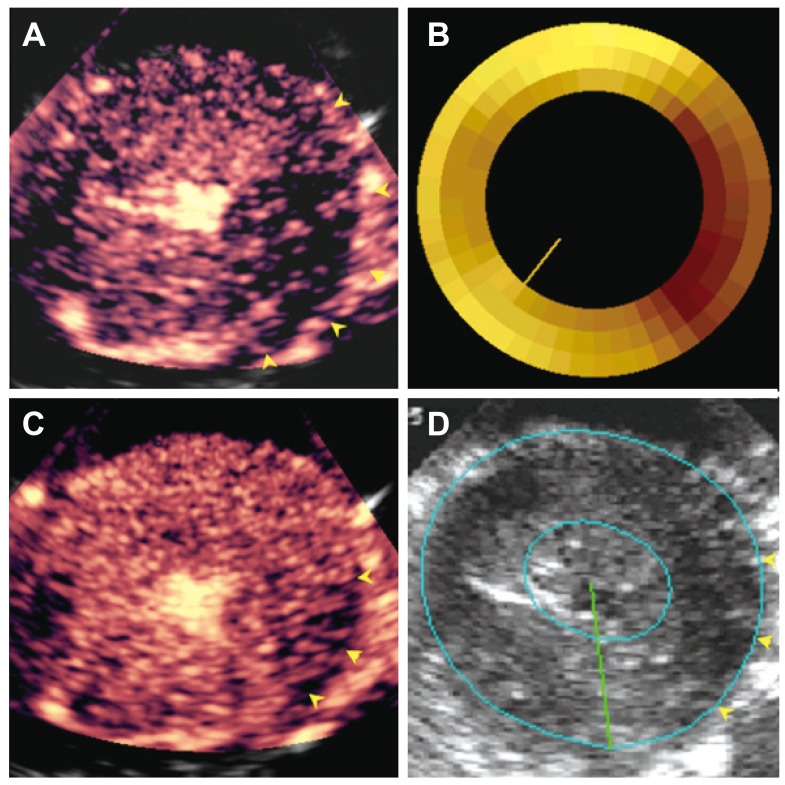
Furthermore, during stress testing, especially in single vessel disease, the sensitivity of wall thickening assessment (stress echo) is reportedly less than that of perfusion assessment (MCE or single-photon emission computed tomography). This again can be explained by collateral flow.27) In single vessel disease, collateral flow is sufficient to prevent wall thickening abnormality. However, the lower than normal collateral flow can appear as abnormal flow during perfusion imaging. Fig. 9 illustrates an example of perfusion defect sizes on MCE and radiolabeled microspheres (Fig. 9A and B) and normal systolic wall thickness in most of the left circumflex bed (Fig. 9D) due to abundant collateral flow, as observed on an image derived several seconds after microbubble destruction (Fig. 9C).
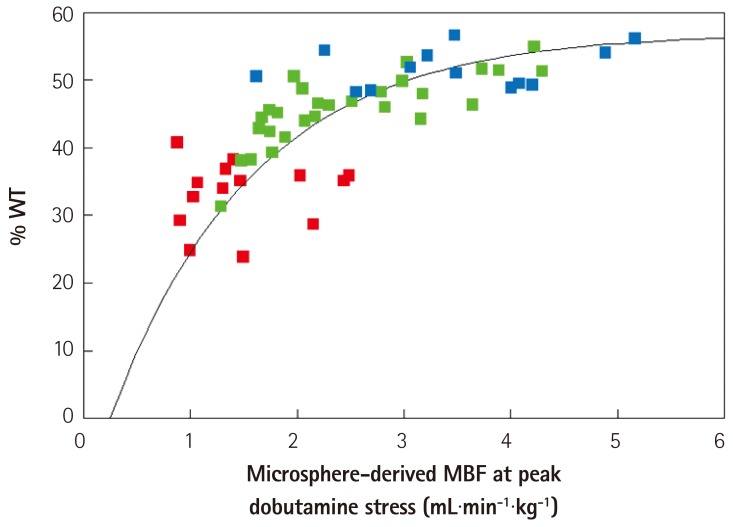
When the flow-function results are plotted (Fig. 10) all data fit on the same curvilinear line with red dots representing the center of the perfusion defect, the green dots representing the collateral-supplied region and the blue dots representing the remote normal myocardium. During stress, wall thickening plateaus at around 2-3 times normal flow, which makes it inherently less sensitive to flow when detecting mild to moderate levels of coronary stenosis.

Summary

Humans have pre-formed collateral vessels that enlarge in ischemia. In addition, new vessels can be formed within ischemic zones from pre-formed endocardial vascular arcades providing rich collateral flow. Under resting conditions, collateral flow of >25% of normal is enough to maintain myocardial viability, but under stress may not be sufficient to prevent myocardial ischemia. Coronary angiography is a poor tool for collateral flow assessment. MCE is the gold standard for experimental and clinical measurement of collateral flow. Collaterals play an important role in acute and chronic coronary syndromes and in modulating the flow-function relations in CAD.

Notes

The authors have no financial conflicts of interest.

References

1. Lower R. Tractatus de corde item de motu et colore sanguinis et chli in eum transitu. KJ Franklin. Ealry Science in Oxford, Vol. 9. Oxford: Oxford University Press;1932. p. 13.
2. Gross L, Kugel MA. The arterial blood vascular distribution to the left and right ventricles of the human heart. Am Heart J. 1933; 9:165–177.
3. Fulton WF. Anastomotic enlargement and ischemic myocardial damage. Br Heart J. 1964; 26:1–15. PMID: 14106121.
4. Baroldi G, Scomazzoni G. Coronary circulation in the normal and pathological heart. Washington, D.C.: Armed Forces Institute of Pathology;1967.
5. Schaper W. Collateral Circulation: past and present. Basic Res Cardiol. 2009; 104:5–21. PMID: 19101749.
6. Cohen MV. Coronary collaterals: clinical & experimental observations. Mount Kisco, N.Y.: Futura Pub. Co.;1985.
7. Kaul S. Myocardial contrast echocardiography: 15 years of research and development. Circulation. 1997; 96:3745–3760. PMID: 9396479.
8. Kaul S. Myocardial contrast echocardiography: a 25-year retrospective. Circulation. 2008; 118:291–308. PMID: 18625905.
9. Sabia PJ, Powers ER, Ragosta M, Sarembock IJ, Burwell LR, Kaul S. An association between collateral blood flow and myocardial viability in patients with recent myocardial infarction. N Engl J Med. 1992; 327:1825–1831. PMID: 1448120.
10. Sabia PJ, Powers ER, Jayaweera AR, Ragosta M, Kaul S. Functional significance of collateral blood flow in patients with recent acute myocardial infarction. A study using myocardial contrast echocardiography. Circulation. 1992; 85:2080–2089. PMID: 1591827.
11. Kaul S, Gillam LD, Weyman AE. Contrast echocardiography in acute myocardial ischemia. II. The effect of site of injection of contrast agent on the estimation of area at risk for necrosis after coronary occlusion. J Am Coll Cardiol. 1985; 6:825–830. PMID: 3897342.
12. Kaul S, Glasheen WP, Oliner JD, Kelly P, Gascho JA. Relation between anterograde blood flow through a coronary artery and the perfusion bed it supplies: experimental and clinical implications. J Am Coll Cardiol. 1991; 17:1403–1413. PMID: 2016458.
13. Kaul S, Pandian NG, Guerrero JL, Gillam LD, Okada RD, Weyman AE. Effects of selectively altering the collateral driving pressure on regional perfusion and function in the occluded coronary bed in the dog. Circ Res. 1987; 61:77–85. PMID: 3608113.
14. Vernon SM, Camarano G, Kaul S, et al. Myocardial contrast echocardiography demonstrates that collateral flow can preserve myocardial function beyond a chronically occluded coronary artery. Am J Cardiol. 1996; 78:958–960. PMID: 8888677.
15. Keller MW, Segal SS, Kaul S, Duling B. The behavior of sonicated albumin microbubbles within the microcirculation: a basis for their use during myocardial contrast echocardiography. Circ Res. 1989; 65:458–467. PMID: 2752551.
16. Jayaweera AR, Edwards N, Glasheen WP, Villanueva FS, Abbott RD, Kaul S. In vivo myocardial kinetics of air-filled albumin microbubbles during myocardial contrast echocardiography. Comparison with radiolabeled red blood cells. Circ Res. 1994; 74:1157–1165. PMID: 8187282.
17. Wei K, Skyba DM, Firschke C, Jayaweera AR, Lindner JR, Kaul S. Interactions between microbubbles and ultrasound: in vitro and in vivo observations. J Am Coll Cardiol. 1997; 29:1081–1088. PMID: 9120163.
18. Wei K, Jayaweera AR, Firoozan S, Linka A, Skyba DM, Kaul S. Quantification of myocardial blood flow with ultrasound-induced destruction of microbubbles administered as a continuous infusion. Circulation. 1998; 97:473–483. PMID: 9490243.
19. Le DE, Jayaweera AR, Wei K, Coggins MP, Lindner JR, Kaul S. Changes in myocardial blood volume over a wide range of coronary driving pressures: role of capillaries beyond the autoregulation range. Heart. 2004; 90:1199–1205. PMID: 15367524.
20. Lindner JR, Song J, Jayaweera AR, Sklenar J, Kaul S. Microvascular rheology of definity microbubbles after intra-arterial and intravenous administration. J Am Soc Echocardiogr. 2002; 15:396–403. PMID: 12019422.
21. Coggins MP, Sklenar J, Le DE, Wei K, Lindner JR, Kaul S. Noninvasive prediction of ultimate infarct size at the time of acute coronary occlusion based on the extent and magnitude of collateralderived myocardial blood flow. Circulation. 2001; 104:2471–2477. PMID: 11705827.
22. Kerber RE, Marcus ML, Ehrhardt J, Wilson R, Abboud FM. Corrrelation between echocardiographically demonstrated segmental dyskinesis and regional myocardial perfusion. Circulation. 1975; 52:1097–1104. PMID: 1182955.
23. Lieberman AN, Weiss JL, Jugdutt BI, et al. Two-dimensional echocardiography and infarct size: relationship of regional wall motion and thinning to the extent of myocardial infarction in the dog. Circulation. 1981; 63:739–746. PMID: 7471327.
24. Lima JA, Becker LC, Melin JA, et al. Impaired thickening of nonischemic myocardium during acute regional ischemia in the dog. Circulation. 1985; 71:1048–1059. PMID: 3986975.
25. Force T, Kemper A, Perkins L, Gilfoil M, Cohen C, Parisi AF. Overestimation of infarct size by quantitative two-dimensional echocardiography: the role of tethering and of analytic procedures. Circulation. 1986; 73:1360–1368. PMID: 3698262.
26. Weyman AE, Franklin TD Jr, Hogan RD, et al. Importance of temporal heterogeneity in assessing the contraction abnormalities associated with acute myocardial ischemia. Circulation. 1984; 70:102–112. PMID: 6723006.
27. Leong-Poi H, Coggins MP, Sklenar J, Jayaweera AR, Wang XQ, Kaul S. Role of collateral blood flow in the apparent disparity between the extent of abnormal wall thickening and perfusion defect size during acute myocardial infarction and demand ischemia. J Am Coll Cardiol. 2005; 45:565–572. PMID: 15708705.
Fig. 1

Post-mortem high-resolution angiogram of a thin transverse section of the heart of a 29 year old normal individual. Note pre-existing collaterals between anterior and posterior circulations, as well as the endocardial arcades formed by the penetrating arteries. From Gross and Kugel,2) with permission from C.V. Mosby Company.

kcj-45-351-g001
Fig. 2

Post-mortem high-resolution angiogram of a thin transverse section of the heart of an older male with left anterior descending artery occlusion, demonstrating abundant collateral vessel development within the LAD bed to circumvent infarction despite the occluded vessel. Compare with Fig. 1. From Fulton et al,3) with permission of the British Medical Association. R: right, L: left, RC: right coronary artery, LC: left circulatory artery, LCxA; left circumflex artery, ANT: left anterior descending artery, ADA: anterior diagonal artery.

kcj-45-351-g002
Fig. 3

Short-axis echocardiographic view of a patient with a totally occluded right coronary artery after acute myocardial infarction taken in the cardiac catheterization laboratory. A depicts a MCE image after microbubble injection into the left main coronary artery showing contrast enhancement of the entire left ventricular myocardium. B depicts the same view after successful angioplasty of the right coronary artery and direct injection of microbubbles, showing the perfusion bed of the right coronary artery. At the time of coronary occlusion, this bed was supplied by collaterals from the left system (top panel). From Sabia et al,9) with permission of the New England Medical Society. MCE: myocardial contrast echocardiography, RV: right ventricle, LV: left ventricle.

kcj-45-351-g003
Fig. 4

Method of measuring myocardial blood flow using MCE. A shows the ultrasound beam elevation (thickness) represented as 'E' in a. If all the microbubbles in the elevation are destroyed by a single pulse of ultrasound at t0, then replenishment of the beam elevation (d1-d4, b-e), will depend on the velocity of microbubbles and time of imaging. B shows the pulsing interval (x-axis) versus video-intensity (y-axis) plot where myocardial blood volume is shown as A and rate of microbubble replenishment is shown as β. The function used to fit the relation is also depicted. Adapted from Wei et al,18) with permission of the American Heart Association. MCE: myocardial contrast echocardiography.

kcj-45-351-g004
Fig. 5

Perfusion defect size at various times after bubble destruction and final infarct size (by tissue staining) in a dog undergoing 6 hours of left circumflex artery occlusion. In this example, although risk area is large (A), the infarct size is small and located at the tip of the posteromedial papillary muscle (C). This is the only region showing a perfusion defect at 10.7s when collaterals have filled the rest of the risk area (B). Adapted from Coggins et al.21) with permission of the American Heart Association.

kcj-45-351-g005
Fig. 6

Perfusion defect sizes at various times after bubble destruction and final infarct size (by tissue staining) in a dog undergoing 6 hours of left circumflex artery occlusion. In this example, although the risk area (A) is the same size as in Fig. 5, the infarct size is much larger (C) because of less collateral-derived flow. The region that became infarcted has no opacification at 9.2 s. (B) Adapted from Coggins et al.21) with permission of the American Heart Association.

kcj-45-351-g006
Fig. 7

Images from a dog undergoing 6 hours of left anterior descending artery occlusion with a large MCE defined risk area (A), confirmed by radiolabeled microspheres (B). The risk area is mostly filled with collateral flow several seconds later (C) resulting in a very small infarct (D). The rest of the risk area is supplied by collateral flow that is lower than in the normal remote myocardium. Thus, the circumferential extent of abnormal wall thickening was greater than the circumferential extent of infarction. MCE: myocardial contrast echocardiography.

kcj-45-351-g007
Fig. 8

Flow-function relation in dogs undergoing 6 hours of total coronary occlusion. The data points in red denote the infarcted zone, those in green denote the collateralized zone, and those in blue denote the normal myocardium. All data points fall on the same line. See text for details. From Leong-Poi et al.27) with permission of the American Heart Association. WT: wall thickening, MBF: myocardial blood flow.

kcj-45-351-g008
Fig. 9

Images from a dog with a non-critical single vessel left circumflex artery stenosis at peak Dobutamine dose with a large MCE-defined risk area (A) that is similar in topology to hypo-perfused zone by radiolabeled microspheres (B). The risk area is almost completely filled by collateral flow a few seconds after microbubble destruction (except for area shown by yellow arrows) (C), resulting in minimal systolic wall thickening abnormality seen on echocardiography (except for area shown by yellow arrows) (D). From Leong-Poi et al.27) with permission of the American Heart Association. MCE: myocardial contrast echocardiography.

kcj-45-351-g009
Fig. 10

Flow-function relation in dogs with non-critical single-vessel stenosis undergoing Dobutamine stress echocardiography. The data points in red denote the central portion of the perfusion defect on MCE. The data points in green are from the intermediate zone within the perfusion defect that fills with collateral flow. The data points in blue denote the remote normal myocardium. All data points fit the same curvilinear relation. At above hyperemic flows of 2-3 mL.min.g-1, wall thickening no longer increases with increase in flow. Thus, wall thickening measures during stress is not as sensitive as blood flow measurement for detection of coronary artery stenosis. See text for details. From Leong-Poi et al.27) with permission of the American Heart Association. WT: wall thickening, MBF: myocardial blood flow.

kcj-45-351-g010
TOOLS
Similar articles