

 PDF
PDF ePub
ePub Citation
 Print
Print


Introduction
Idiopathic ventricular premature depolarization (VPC) is a monomorphic event in patients with a structurally normal heart. This arrhythmia has clinical importance because it is common in the general population1)2)3) and because some individuals with the disorder develop sudden cardiac death or cardiomyopathy (CMP).4)5)6)7)8)9)10) Idiopathic VPCs are often accompanied by a variety of symptoms. However, the understanding of the basis of the symptoms frequently observed in this disorder remains limited. Site of origin,11)12)13)14)15) coupling interval (CI),16)17)18)19)20)21)22)23) and VPC burden24)25)26) are important factors influencing the hemodynamic consequences of VPCs. We hypothesized that hemodynamic differences are correlated with the differences in VPC symptoms. The aim of this prospective study was to identify predictors of palpitations related to idiopathic VPCs by analyzing demographic information and surface electrocardiogram (ECG) parameters.
Subjects and Methods
Patient population
All enrolled patients were diagnosed with frequent VPCs at Konkuk University Medical Center from January 2012 to February 2014. The study protocol was approved by the hospital's Institutional Review Board. Inclusion criteria were predominant VPCs exhibiting ECG characteristics suggestive of outflow tract (OT) origin (right or left bundle branch morphology and an inferior axis), age≥19 years, frequent VPCs (>10% VPC burden per 24 hours) according to 24-hr Holter ECG monitoring at enrollment without undergo medical or procedural VPC suppression, full description of symptoms in the medical records including questionnaire and Holter monitoring, and baseline echocardiography and Holter monitoring at enrollment. The exclusion criteria were history of atrial fibrillation, atrial flutter, atrial tachycardia, nonsustained ventricular tachycardia, sustained ventricular tachycardia, or evidence for any of these arrhythmias by 12-lead ECG or Holter ECG monitoring; history of myocardial infarction, structural heart disease, or heart valve replacement/repair; and any evidence of ischemic/structural heart disease based on information obtained from the echocardiogram, radionuclide evaluation, and/or cardiac catheterization. In the patients with VPC-induced CMP, transthoracic echocardiography was performed after the procedure to assess any structural changes and to confirm the status of the left ventricular ejection fraction (LVEF) in the absence of VPCs after a successful radiofrequency (RF) ablation or medical treatment. If the patients had a depressed LVEF (<50%), we enrolled only patients who recovered their left ventricular (LV) function back to normal (an improvement in the LVEF of ≥10% to a final LVEF of ≥50%) after successful VPC suppression. Successful treatment was defined as at least an 80% reduction in the 24-hr burden of VPCs, based on our previously published experience.27) Patients were divided into two subgroups (symptomatic or asymptomatic) according to the presence or absence of typical VPC-related symptoms. Symptom evaluation was determined by reviewing the cardiology records (medical records created by a cardiologist). If the patient did not feel any palpitations or "dropped beats" related to VPCs observed on an ECG, the patient was assigned to Group A. If a patient felt palpitations or dropped beats when VPCs appeared on an ECG or Holter monitoring, this was defined as a typical VPC-related symptom, and the patient was assigned to Group B. Especially, a Holter monitoring and a questionnaire at enrollment was evaluated in detail to match the correlation between the clinical VPC and the symptom. If a patient recorded any symptoms (palpitation or dropped beats) during an episode of VPCs on Holter monitoring, the patient was judged to have a typical VPC-related symptom. All asymptomatic patients were diagnosed with frequent VPCs during regular ECG check-ups or before non-cardiac procedures or operations. They were referred to our institution for further management of their VPCs.
Electrocardiography measurements
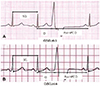
The 12-lead ECG was recorded at a sweep speed of 100 ms and analyzed off-line with a Muse® Cardiology Information System (GE Healthcare, Piscataway, NJ, USA) using digital calipers. VPCs were evaluated with respect to the QRS duration, amplitude, and morphology. VPC notching in the precordial and limb leads was evaluated. Notching was defined as a >40 msec (ms) interval between the initial and second peaks of the QRS complex in the precordial or limb leads. Several other ECG parameters were measured on the surface ECG (Fig. 1):
• Baseline sinus cycle length (ms): from the R peak of one sinus beat to the R peak of the next sinus beat
• VPC QRS width (ms): from the onset of the VPC to the terminal S wave
• VPC CI (ms): from the onset of the R wave of the previous sinus beat to the onset of the VPC
• VPC CI ratio (%): VPC CI/sinus cycle length×100%
• Post-VPC CI: from the onset of the VPC to initiation of the next sinus beat
• Post-VPC CI ratio (%): post-VPC CI/sinus cycle length×100%
• VPC amplitude (mV): highest amplitude of the VPC in the precordial leads
The Muse® Cardiology Information System (GE Healthcare, Piscataway, NJ, USA) was used to measure the width and amplitude of the VPCs, as well as CI and cycle length of both the VPCs and sinus beats. To assess intra-observer variation, parameters were measured for five consecutive normal sinus rhythms and VPC beats.
Data collection
For the patients who underwent successful RF ablation procedure, the baseline demographic data, history, and other clinical characteristics were collected prospectively. Additional clinical and ECG parameters were assessed retrospectively in all enrolled patients by a detailed medical record review. All ECG measurements were performed using digital calipers at 100 mm/s, on the Muse® Cardiology Information System (GE Healthcare, Piscataway, NJ, USA). For each measured parameter, the mean of five measurements was used for analysis to minimize the influence of the measurement error. For patients with multiple VPC morphologies, only the dominant type of VPCs was measured.
Statistical analysis
Pearson's product moment correlation coefficient was calculated to quantify inter-rater variability in the measurement of both VPC QRS duration and VPC coupling interval. Continuous data are expressed as mean±standard deviation unless otherwise specified. Between-groups comparisons were performed using Student's t-tests, whereas within-group comparisons were performed using paired t-tests. For comparisons of non-continuous variables, chi-square tests were used. SPSS Version 18.0 for Windows (SPSS, Chicago, IL, USA) software was employed for the analysis. For all tests, p<0.05 was considered statistically significant.
Results
A total of 118 patients with frequent OT VPCs were prospectively enrolled. Among these, six patients with structural heart disease were excluded. One had arrhythmogenic right ventricular CMP and five had ischemic CMP. Another three patients continued to have LV dysfunction after successful VPC suppression; all were excluded due to the suggestion of structural heart disease. Thus, 109 patients (63 males, 49±16 years old) with OT VPCs were enrolled. Group A included 30 patients and Group B included 79 patients (Table 1). Twenty-three patients (21%) underwent successful radiofrequency catheter ablation for VPC-induced CMP and drug-resistant frequent symptomatic (typical and/or atypical VPC symptoms) VPCs: 13 in Group A and 10 in Group B. Depressed LVEF was present in 27 patients: 19 (63%) in Group A and 8 (10%) in Group B. In accordance with our inclusion criteria, all patients had >10% VPC burden on 24-hr Holter monitoring. Nine patients had two or more VPC morphologies, but their dominant VPCs exhibited OT ECG characteristics.
Baseline characteristics of Group A and Group B
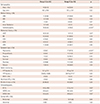
There were no significant differences between groups for age (Group A vs. Group B: 46.1±16.6 vs. 50.1±13.9 years, p=0.22), body surface area (p=0.34), daily VPC burden (Group A vs. Group B: 22.1±11.9 vs. 26.5±12.8%, p=0.15), and VPC site of origin (p=0.39) (Table 1). Except for antiarrhythmic drugs (p=0.01), there were no other significant differences between groups in the use of medications including beta-blockers (p=0.19), calcium channel blockers (p=0.60), angiotensin converting enzyme inhibitors (p=0.73), and angiotensin receptor blockers (p=0.48). VPC-related typical symptoms (palpitations and dropped beats) occurred only in Group B. The incidence of atypical VPC symptoms (shortness of breath, syncope, dizziness, and fatigue) was similar between Group A and Group B. LVEF was significantly lower in Group A (Group A vs. Group 44.3±16.5 vs. 57.2±14.1%, p=0.02), and the LV end-systolic dimension (Group A vs. Group B: 32.3±5.2 vs. 28.5±4.3 mm, p=0.02). The LV end-diastolic dimension (Group A vs. Group B: 54.4±6.3 vs. 49.7±5.6 mm, p=0.01) were significantly greater in Group A.
Electrocardiogram parameters
For all enrolled patients, there were no significant differences in sinus QRS width (p=0.17), sinus cycle length (p=0.86), VPC CI (p=0.82), VPC QRS width (p=0.12), post-VPC CI (p=0.68), and post-VPC CI ratio (p=0.16) between Group A and Group B (Table 2). The VPC CI ratio was significantly higher in Group B (Group A vs. Group B: 149±22 vs. 60±15%, p=0.01). The VPC amplitude in the precordial (p=0.86) and limb leads (p=0.53), and the incidence of a notch in the precordial leads (p=0.09) were not significantly different between Groups A and B. However, the incidence of a notch in the limb leads was significantly higher in Group A (Group A vs. Group B: 50% vs. 26%, p=0.03). There was no significant different in the bundle branch block pattern (p=0.31) between Groups A and B (Table 3). A right bundle branch block pattern was observed in nine patients (20.8%) in Group A and 16 (15.8%) in Group B. The distribution of precordial R wave transition did not differ between Groups A and B (p=0.88). In Group A, early transition (before V3) occurred in seven patients (23.3%) and late transition (after V3) occurred in 17 patients (57.4%). In Group B, early transition occurred in 15 patients (18.8%) and late transition in 47 patients (59.4%). The distribution of QRS axis also did not significantly differ between groups (p=1.00). An inferior axis was observed in all patients in both groups. In the normal EF group, there were no significant differences in sinus QRS width (p=0.37), sinus cycle length (p=0.05), VPC QRS width (p=0.62), VPC CI (p=0.82), post-VPC CI (p=0.45), and post-VPCs CI ratio (p=0.37) between Groups A and B (Table 4). The VPC CI ratio was significantly higher in Group B than in Group A (Group A vs. Group B: 48±20 vs. 59±11%, p<0.01). The incidence of a notch in both the precordial and limb leads was similar for Groups A and B. In the depressed EF group, there were no significant difference in sinus QRS width (p=0.21), sinus cycle length (p=0.08), VPC QRS width (p=0.61), VPC CI (p=0.88), post-VPC CI (p=0.63), and post-VPC CI ratio (p=0.67) between Group A and Group B (Table 4). The VPC CI ratio was significantly longer in Group B than Group A (Group A vs. Group B: 50±31 vs. 61±23%, p=0.01). The incidence of a notch in the limb leads was significantly higher in Group B (p=0.04).
Discussion
Differences in VPC-related symptoms originate from hemodynamic changes during differing clinical situations. However, to the best of our knowledge, no previous studies have examined the specific factors that may explain VPC-related symptom differences. VPC burden and other factors, such as the myocardial status, site of VPC origin, CI between the preceding sinus beat and VPC, and QRS width, might have differing hemodynamic effects on the heart and thereby produce differing symptoms. In this study, we tried to identify predictors of typical VPC-related symptoms (palpitations and dropped beats) by analyzing demographic information and ECG characteristics.
Only patients with VPCs that originated from OT sites were enrolled to minimize hemodynamic changes due to differing sites of VPC origin. VPC CI itself was not an important factor for the occurrence of typical VPC-related symptoms. Rather, a VPC CI ratio between the VPC and previous sinus beat >50% appeared to be associated with the presence of these symptoms. Additional subgroup analysis showed that the VPC CI ratio was significantly higher in patients with typical VPC-related symptoms, irrespective of LV function.
Several previous studies have reported that hemodynamic differences are related to the VPC site of origin, CI between the sinus beat and VPC, and myocardial status. If a VPC occurs in the LV, it may have greater hemodynamic significance than a VPC originating in the right ventricle (RV). RV VPCs are conducted to the LV later than LV VPCs, thereby allowing more time for ventricular filling than LV VPCs. Considering the site of origin, OT VPCs might have a greater hemodynamic significance than those originating from the LV apex. When a VPC develops in the OT, the ventricular contraction travels from the OT to the LV apex and lateral walls, which is opposite to the normal direction of blood flow from a ventricular contraction originating in the LV apex.
The CI between the previous sinus beat and VPC is also an important parameter contributing to different hemodynamic effects. A shorter CI may have greater hemodynamic significance than a longer CI. If OT VPCs occur after a short CI, there may be an inadequate time for LV filling, thus reducing the stroke volume, in accordance with the Frank-Starling's law.20) However, when the OT VPC occurs after a long CI, this will provide more time for ventricular filling, and the patient may feel the increased blood flow.
It is not clear why patients without typical VPC-related symptoms had a higher incidence of VPC-induced CMP. One possibility is that patients without specific symptoms did not present to the clinic until later in the course of their disease. By contrast, symptomatic VPC patients may have had less chance to develop more severe ventricular dysfunction because they presented to the clinic earlier and, thereby, received treatment earlier.
To the best of our knowledge, this study is the first to identify a link between VPC-related symptoms and hemodynamic changes by using ECG parameters. Although we enrolled patients with only OT-site VPCs in this study, the results suggest that VPC-related symptoms occur because of an increased VPC CI ratio. The physiologic and pathologic basis for the noted VPC CI ratio differences associated with the VPC-related symptoms deserves further prospective study.
Limitations
We specifically selected VPCs that originated from the OT of both ventricles, so the results may not represent symptom-related hemodynamics of other VPC sites of origin. Determining whether patients did or did not have symptoms associated with VPCs was a critical aspect of the study, as it was used to divide the patients into the appropriate groups. However, this process was difficult using a simple medical record analysis. Symptoms may show day-to-day and time-to-time variation. Even though we measured the CI at five time points to check reliability, VPC related symptoms are also associated with the change of autonomic nervous system and emotional status in addition to the coupling interval. Also, we could not match the VPC-related symptoms to each VPC with just surface ECG and Holter monitoring. Another potential limitation of the study was that the sinus cycle length may continuously change throughout the day. Therefore, the CI ratio and other parameters used in this study would vary (and not be a single value) during each sampling period. To minimize the influence of measurement error because of this variation, the mean of five ECG measurements was used for our analysis. In addition, the main indication for VPC ablation in patients with normal ventricular function was the presence of severe symptoms. Consequently, the asymptomatic group was smaller than the symptomatic group. Another limitation was that the patients included in the study were those who were referred to our institution for further management (ablation and/or medications), and thus our findings may have been influenced by referral bias. We were unable to systematically track those patients who were not referred to our institution or those who refused to take medications or undergo ablation. This limitation is shared with prior reports of ablation in this population.
Conclusion
VPC-related palpitations or dropped beats appear to be associated with a greater VPC CI ratio (>50%) in the setting of spontaneous OT VPCs in patients with idiopathic VPCs. The physiologic and hemodynamic basis for the VPC CI ratio differences associated with differences in VPC-related symptoms deserves further study.


 XML Download