Journal List > Korean Circ J > v.45(4) > 1017249

Sim, Ahn, Kim, Seon, Park, Yoon, Yoon, Kim, Hong, Park, Kim, Jeong, Cho, and Park: The Relationship among N-Terminal Pro-B-Type Natriuretic Peptide, High-Sensitivity C-Reactive Protein and Infarct Size in Patients with Acute ST-Elevation Myocardial Infarction

Abstract

Background and Objectives

We sought to investigate the relationship between levels of high-sensitivity C-reactive protein (hs-CRP) and N-terminal pro-B-type natriuretic peptide (NT-proBNP) and the infarct size and left ventricular (LV) volume after acute myocardial infarction (MI).

Subjects and Methods

Eighty-six patients with acute ST-elevation MI underwent delayed enhancement multidetector computed tomography immediately after they underwent percutaneous coronary intervention to determine the infarct size. LV function and remodeling were assessed by echocardiography. Hs-CRP and NT-proBNP were measured at admission, 24 hours and two months later.

Results

Both hs-CRP and NT-proBNP at 24 hours showed a positive correlation with infarct size and a negative correlation with LV ejection fraction at the baseline and two months later. NT-proBNP at two months correlated with infarct size, LV ejection fraction, and LV end diastolic and systolic volume indices at two months. In patients with high NT-proBNP levels at 24 hours and two months, infarct size was larger and LV ejection fraction was lower. NT-proBNP was higher in patients who developed LV remodeling at two months: 929 pg/mL vs. 134 pg/mL, p=0.002. In contrast, hs-CRP at two months showed no relationship to infarct size, LV function, or LV volumes at two months.

Conclusion

Elevated hs-CRP level 24 hours after the onset of acute MI is associated with infarct size and LV dysfunction, whereas elevated levels of NT-proBNP 24 hours and two months after the onset of acute MI are both correlated with infarct size, LV dysfunction, and LV remodeling.

Introduction

Elevated levels of high-sensitivity C-reactive protein (hs-CRP) and N-terminal pro-B-type natriuretic peptide (NT-proBNP) after acute myocardial infarction (MI) are associated with adverse cardiovascular events.1)2)3)4)5)6)7)8)9)10) However, the mechanisms by which these biomarkers affect the prognosis following acute MI are not completely understood. Previous studies have inconsistently reported the roles of hs-CRP and NT-proBNP in the progression of infarct expansion and left ventricular (LV) remodeling after acute MI.11)12)13)14) In the present study, we sought to investigate the relationship between the levels of serially measured serum hs-CRP and NT-proBNP and parameters of infarct size, LV function, and LV volume after acute MI using delayed enhancement (DE) multidetector computed tomography (MDCT) and two-dimensional (2D) echocardiography.

Subjects and Methods

Patient selection

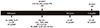
This is a sub-study of our recent prospective, randomized trial evaluating the effect of thrombus aspiration on infarct size utilizing DE MDCT.15) We designed and conducted the research on 86 patients with ST-segment-elevation MI between April 2009 and March 2011.15) Details of the study protocol have been described.15) All of the 86 patients from the trial were included in the present study. The inclusion criteria were acute ST-elevation MI within <12 hours after the onset of symptom and the ability to undergo a complete MDCT examination (Killip I and II) with the ability to hold their breath for 15-seconds. Exclusion criteria were previous MI or coronary artery bypass graft surgery, cardiogenic shock, left main disease, severe valvular heart disease, unsuccessful percutaneous coronary intervention (PCI) {post-PCI Thromolysis In Myocardial Infarction (TIMI) flow <2 or ≥50% residual stenosis in the infarct-related artery}, rescue or facilitated PCI, contraindication to glycoprotein IIb/IIIa inhibitors, and the inability to obtain informed consent. Fig. 1 shows the scheme of the study.

Medication

Before PCI, patients were treated with aspirin (a bolus of 300 mg, followed by 100 mg/day), clopidogrel (600 mg followed by 75 mg/day), intravenous unfractionated heparin, and intravenous nitroglycerin. Oral atenolol 50-100 mg was given to optimize the heart rate so that it was ≤65 beats per minute prior to the computed tomography (CT) scan, unless contraindicated. During PCI, 5,000 to 10,000 IU of heparin was administered guided by measurements of activated clotting time. In patients with atrial fibrillation, a large dyskinetic area of the left ventricle, and in immobile patients, heparin was maintained for between one to three days after the sheath was removed. Glycoprotein IIb/IIIa inhibitor (abciximab) and thrombus aspiration were performed at the discretion of the operator. Standard long-term therapies after PCI included aspirin 100 mg, clopidogrel 75 mg, beta-blockers, statin, and angiotensin-converting enzyme inhibitors or angiotensin II receptor blockers, according to current international guidelines.16)

Coronary angiography

A coronary angiogram was obtained at the baseline (i.e., before the PCI procedure) and after the procedure (i.e., after stent placement). TIMI flow grades were estimated as previously described.17) Total iodine volume and time lasting from the last coronary injection to the CT scan were measured. The TIMI myocardial perfusion grade was assessed after PCI.18) The evaluation of the myocardial blush grade was performed as described by van't Hof et al.19)

Electrocardiography

A standard 12-lead electrocardiography (ECG) was acquired at the time of presentation and 90 minutes after the end of the procedure. The magnitude of ST-segment elevation was measured 60 milliseconds from J point. The ST-segment score was calculated as the sum of the ST-segment elevation >0.1 mV for leads V1 through V6 and I, II, and aVL in anterior infarction and I, II, aVF, V5, and V6 in non-anterior infarction. The resolution percentage of ST-segment elevation was categorized as complete (>70%), partial (30%-70%), or absent (<30%).20)

Cardiac computed tomography scans for delayed enhancement

Cardiac CT scans were performed with a 64-slice MDCT scanner (Sensation Cardiac CT 64; Siemens Medical Solutions, Erlangen, Germany) with a retrospective ECG-gated dose modulation technique. The scanning protocol for the initial cardiac CT was as follows: collimation, 0.75 mm; pitch, 0.2; gantry rotation time, 330 msec; a tube voltage, 120 peak kilovoltage; a tube current, 600 milliampere second. Initial cardiac CT scans were performed immediately after the PCI, by transporting the patient from the cardiac catheterization laboratory to the CT scanner as quickly as possible after the PCI. Intravenous contrast material, iopromide (Ultravist 370®, Bayer Schering Pharma, Berlin, Germany), was only administered during coronary angioplasty; additional contrast material was not given specifically for the cardiac CT scan. The median total volume of contrast material used during the revascularization procedure was 160 mL and the median time delay between the last contrast injection and the CT acquisition was 13 min. Follow-up cardiac CT scans were performed at two months after PCI. After the coronary CT angiography, five-minute delayed CT scanning was performed using the same technique as in the initial CT scan except for the contrast enhancement. For the contrast enhancement, 60-70 mL of iopromide (Ultravist 370®, Bayer Schering Pharma, Berlin, Germany) was injected via the antecubital vein, followed by 60 mL of saline chase at a rate of 4 mmL/s. Image reconstructions were performed on a 3D workstation (Wizard™, Siemens medical solution, Forchheim, Germany) during the mid-diastolic phase (75% of the cardiac cycle). The volume of myocardium with delayed contrast enhancement on cardiac CT imaging was assessed using a 15-mm thick multi-planar reconstruction in the short axis and horizontal long axis. Average radiation exposure for each cardiac CT was 4.5 millisievert (dose length product: 264 milligray.cm, conversion factor: 0.017 millisievert/milligray.cm, scan range: from the proximal left anterior descending artery upper 2-3 cm to the cardiac apex lower 1-2 cm).

Infarct size, left ventricular function and volume measurement

The infarct size was measured by assessing the regional extent of DE using a cardiac MDCT scan immediately after the PCI and at two months after the procedure to estimate the infarct size, which was defined by the total volume (mL) of myocardium showing DE.15) The volume of DE obtained by areas of hyperenhanced myocardium was traced in each slice and multiplied by the thickness of the slice. The extent of hyperenhanced regions was computed in milliliters. Recent studies have demonstrated the utility of DE MDCT in determining the infarct size.21)22) In addition, a 2-D echocardiography was performed to evaluate LV function and volumes at the baseline and two months later. LV remodeling was assessed by the difference in the LV end-diastolic volume (LVEDV) between the initial and two-month values on 2-D echocardiography. LV remodeling was defined as the change in the LVEDV index >20%.23)

Biochemical measurements

Cardiac markers were measured serially up to 36 hours after admission to the hospital. Hs-CRP and NT-proBNP were measured at admission, and 24 hours and two months following hospitalization. Cardiac troponin I was measured with the heterogeneous immunoassay module cardiac troponin-I flex® reagent cartridge for Dimension® (Date Behring, Marburg, Germany). Cardiac troponin-T was determined by an electrochemiluminescence immunoassay on the Elecsys 2010 system (Roche Diagnostics, Mannheim, Germany). Serum hs-CRP was determined by using particle-enhanced immunonephelometry (CardioPhase® hs-CRP, Siemens Medical Solutions Diagnostics, Deerfield, USA). Serum NT-proBNP was measured by a monoclonal electrochemiluminescence immunoassay (Elecsys proBNP II; Roche Diagnostics; Mannheim, Germany) on an analyzer (MODULAR ANALYTICS EVO, E170 module; Roche Diagnostics; Mannheim, Germany).

Statistical analysis

Continuous variables were expressed as mean standard deviation (±SD) and were compared between groups with the student t test or paired t test when normally distributed; they were expressed as median (interquartile range) and were compared with the Mann-Whitney U test or a Wilcoxon signed rank test when the data did not fit a normal distribution, as evaluated by the Kolmogorov-Smirnov test. Correlations between serum hs-CRP or NT-proBNP and the two-month change in the indices of infarct size, LV function, and LV volumes were measured by the Spearman correlation coefficient at a significance level of 0.05. Changes in hs-CRP and NT-proBNP levels from baseline values were evaluated using repeated measurements-analysis of variance tests after log transformation. The Statistical Package for the Social Sciences version 17.0 (SPSS Inc, Chicago, IL, USA) was used for all statistical analysis.

Results

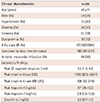
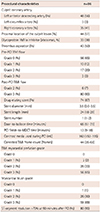
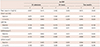
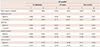
Table 1 and 2 list baseline clinical characteristics and procedural results of the study patients. Table 3 and 4 show changes in levels of hs-CRP and NT-proBNP and indices of infarct size, LV function, and LV volume over the two months. Both hs-CRP and NT-proBNP levels changed significantly over the two months. The index significantly increased at two months compared to the baseline: 52.7±16.8 mL/m2 vs. 44.4±18.8 mL/m2, p=0.022.
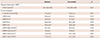
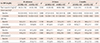
Table 5 and 6 reveal the correlation between the indices of infarct size, LV function, and LV volume and hs-CRP and NT-proBNP at admission, and 24 hours and two months later. The level of hs-CRP at 24 hours was positively correlated with peak troponin-I level (r=0.452, p=0.002), infarct size by DE MDCT at the baseline (r=0.560, p<0.001) and negatively correlated with LV ejection fraction at the baseline (r=-0.375, p=0.010). However, the level of hs-CRP at two months had no relationship to infarct size, LV function, or LV volumes. NT-proBNP at 24 hours was positively correlated with peak troponin-I level (r=0.364, p=0.027), infarct size by DE MDCT at the baseline (r=0.394, p=0.016) and negatively correlated with LV ejection fraction at the baseline (r=-0.591, p<0.001). NT-proBNP at two months showed a significant correlation with the infarct size at two months (r=0.561, p=0.007), LV ejection fraction at two months (r=-0.539, p=0.010), and LV end diastolic and systolic volume indices at two months (r=0.796, p=0.032 and r=0.831, p=0.021, respectively). Forty-five patients (52%) developed LV remodeling at two months and the NT-proBNP level was significantly higher in these patients compared to those without LV remodeling: 929 pg/mL (680 to 2544) vs. 134 pg/mL (78 to 411), p=0.002.
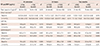
Table 7 and 8 show differences in infarct size, LV function, and LV volumes according to levels of hs-CRP and NT-proBNP dichotomized by the median values at the baseline, and 24 hours and two months later, respectively. Overall, the results were similar to those of bivariate correlation comparisons. The higher hs-CRP group at 24 hours showed a higher level of peak troponin-I and lower LV ejection fraction. There were no differences between higher and lower hs-CRP groups at the baseline and at two months. Higher NT-proBNP groups at 24 hours and two months showed larger infarct size and lower LV ejection fraction.

Discussion

The present study revealed that elevated hs-CRP during myocardial damage was associated with infarct size and LV dysfunction, whereas elevated levels of NT-proBNP 24 hours and two months after the onset of acute MI were both correlated with infarct size, LV dysfunction, and LV remodeling.
DE MDCT was utilized in our study to determine infarct size during the acute phase and two months later. DE MDCT immediately after primary PCI accurately quantifies the infarct size without the need for additional contrast injection in patients with ST-elevation MI,21) whereas nuclear testing or cardiac magnetic resonance imaging (MRI) is difficult to perform in an acute setting and the gadolinium-enhanced region on an MRI may include interstitial edema in reversibly injured myocardium within the periinfarct zone. This may lead to overestimating the infarct size when performed within the first week after the onset of acute MI.24) In addition, a recent study demonstrated the prognostic value of myocardial contrast DE with MDCT after acute MI.25)
Increased C-reactive protein (CRP) levels in acute MI have been associated with enzymatic infarct size and adverse clinical outcomes.1)2)3)4) However, there are few reports on the relationship between CRP level and the degree of myocardial damage over time after acute MI. In the present study, we found a marked rise in hs-CRP levels 24 hours following successful primary PCI for acute ST-elevation MI. This result was consistent with a recent study that demonstrated a relationship between CRP level and infarct size using cardiac MRI.26) We observed that hs-CRP at admission and two months later was not correlated with infarct size or LV function, suggesting that hs-CRP better reflects myocardial damage and subsequent LV dysfunction after 24 hours from the onset of acute MI. This finding may be instrumental in understanding the conflicting results of clinical trials on the predictive value of CRP after acute MI.4)5)27) Elevated serum CRP obtained within 12 to 24 hours of the onset of symptoms in a study of 448 patients with acute MI (ST-elevation MI: 76%) was associated with larger echocardiographic infarct size, 30-day mortality, and the development of heart failure.4) In contrast, CRP measured within six hours of symptom-onset in 483 patients with acute ST-elevation MI was not associated with 30-day mortality or the development of heart failure.5) Similarly, CRP measured two months after acute MI in a study of 957 patients was not a predictor of cardiac death or recurrent nonfatal MI during a two-year follow-up.27) These discrepancies may in part be explained by the timing of CRP measurement, indicating that the peak CRP level after acute MI may predict an early clinical outcome. Recently, it has been indicated that CRP levels are associated with the development of post-MI LV remodeling, as well as being a predictor of long-term prognosis in patients with acute MI.11)12)14) In our study, however, hs-CRP failed to show a correlation with either indices of LV remodeling or with infarct size at two months. This may be because all patients in our study received successful reperfusion therapy and global LV function was relatively preserved. This seemed to limit the development of significant LV remodeling.
The plasma level of BNP in patients with acute MI reaches a peak approximately 20 hours after the onset of symptoms, and this may reflect an acute phase reaction to the extent and severity of the initial ischemic insult.28)29) A second peak may occur between four and seven days later probably in relation to infarct expansion and subsequent LV dysfunction and remodeling.13)28) In the present study, NT-proBNP at 24 hours was correlated with initial infarct size and LV ejection fraction. NT-proBNP at two months showed a correlation with LV ejection fraction and LV volumes at two months. There was no correlation between NT-proBNP level at 24 hours and LV volumes at two months. This may indicate that increases in NT-proBNP levels at 24 hours are related more to the acute phase response associated with early myocardial necrosis after acute MI than to the persistently increased regional mechanical force, whereas NT-proBNP levels at two months reflect progressive LV remodeling.13) Elevated BNP levels at various time points (<6-12 hours, 24-96 hours, 3-4 weeks) after acute MI have been associated with increased mortality.5)6)7)8)9)10) The results of our study are in agreement with similar studies incorporating left ventriculography,13) ECG,14) or cardiac MRI,30) and may provide a theoretical basis for the prognostic benefit of NT-proBNP in patients with acute MI. However, our analysis did not show a significant relationship between NT-proBNP on admission and parameters of infarct size and LV function. This may be related to the small sample size and to the fact that LV function was relatively preserved in our population, in which all patients were treated with successful primary PCI, followed by optimal pharmacologic treatment.
There are limitations to the present study. Only a moderate correlation was observed between hs-CRP and NT-proBNP and parameters of infarct size, LV function, and LV volumes. This may be as a result of successful reperfusion therapy in all patients during the early stage of acute MI, thereby limiting infarct expansion and severe LV dysfunction. In addition, the number of patients was small for comparative study or logistic multivariate analysis to assess the clinical outcome.
In conclusion, increased levels of hs-CRP and NT-proBNP 24 hours after acute MI reflect the extent of and reaction to myocardial damage. Elevated hs-CRP 24 hours after the onset of acute MI is associated with infarct size and LV dysfunction, whereas elevated levels of NT-proBNP 24 hours and two months after the onset of acute MI are both correlated with infarct size, LV dysfunction, and LV remodeling. These observations may help understand the time-dependent utility of these myocardial performance markers in patients with acute MI.

Figures and Tables

Fig. 1

Scheme of the study protocol. CK: creatine kinase, CKMB: creatine-kinase MB, Tn-I/T: troponin-I/T, hs-CRP: high-sensitivity C-reactive protein, NT-proBNP: N-terminal pro-B-type natriuretic peptide, DE MDCT: delayed enhancement multidector computed tomography, PCI: percutaneous coronary intervention, 2DE: two-dimensional echocardiography, CTFC: corrected Thrombolysis In Myocardial Infarction frame count, TMPG: Thrombolysis In Myocardial Infarction myocardial perfusion grade, MBG: myocardial blush grade, ECG: electrocardiogram.

kcj-45-285-g001
Table 1

Baseline clinical characteristics and laboratory findings

kcj-45-285-i001
Clinical characteristics n=86
Age (years) 61±11
Male (%) 59 (69)
Hypertension (%) 35 (41)
Diabetes (%) 26 (30)
Smoking (%) 51 (59)
Dyslipidemia (%) 10 (12)
Killip class I/II (%) 47(55)/39(45)
Symptom-to-door time (minutes) 180 (60-240)
Anterior myocardial infarction (%) 48 (56)
Laboratory findings
 Peak ST-segment elevation (mm) 2.5 (1.5-4.0)
 Peak creatine kinase (U/L) 1780 (853-3357)
 Peak creatine-kinase MB (U/L) 108 (52-214)
 Peak troponin-I (ng/mL) 67 (36-122)
 Peak troponin-T (ng/mL) 2.8 (0.5-10.5)
 Creatinine (mg/dL) 0.9 (0.7-1.0)

Values are expressed as mean±SD, n (%), or median (interquartile range) unless otherwise specified.

Table 2

Procedural characteristics

kcj-45-285-i002
Procedural characteristics n=86
Culprit coronary artery
 Left anterior descending artery (%) 48 (56)
 Left circumflex artery (%) 3 (3)
 Right coronary artery (%) 35 (41)
Proximal location of the culprit lesion (%) 44 (51)
Glycoprotein IIb/IIIa inhibitor (abciximab, %) 33 (38)
Thrombus aspiration (%) 43 (50)
Pre-PCI TIMI flow
 Grade 0 (%) 56 (65)
 Grade 1 (%) 10 (12)
 Grade 2 (%) 17 (20)
 Grade 3 (%) 3 (3)
Post-PCI TIMI flow
 Grade 2 (%) 6 (7)
 Grade 3 (%) 80 (93)
 Drug-eluting stent (%) 74 (87)
 Stent diameter (mm) 3.5 (3.0-3.5)
 Stent length (mm) 24 (18-28)
 Stent number 1 (1-2)
 Door-to-balloon time (minutes) 65 (51-79)
 PCI finish-to-MDCT time (minutes) 13 (9-18)
 Contrast media used during PCI (mL) 160 (150-195)
 Corrected TIMI frame count (frames) 44 (35-61)
TIMI myocardial perfusion grade
 Grade 0 0
 Grade 1 (%) 2 (2)
 Grade 2 (%) 28 (33)
 Grade 3 (%) 56 (65)
Myocardial blush grade
 Grade 0 0
 Grade 1 (%) 1 (1)
 Grade 2 (%) 26 (30)
 Grade 3 (%) 59 (69)
ST-segment resolution >70% at 90 minutes after PCI (%) 80 (93)

Values are presented as n (%) or median (interquartile range). PCI: percutaneous coronary intervention, TIMI: Thrombolysis in Myocardial Infarction, MDCT: multidector computed tomography

Table 3

Hs-CRP and NT-proBNP levels at admission, and at 24 hours and two months later

kcj-45-285-i003
At admission 24 hours Two months p
hs-CRP (mg/dL) 0.09 (0.05-0.36) 0.98 (0.32-2.01) 0.04 (0.02-0.14) <0.001
NT-proBNP (pg/mL) 145 (36-324) 1233 (603-2,636) 262 (79-605) <0.001

Values are presented as median (interquartile range). Hs-CRP: high-sensitivity C-reactive protein, NT-proBNP: N-terminal pro-B-type natriuretic peptide

Table 4

Infarct size and left ventricular function and volumes at the baseline and two months later

kcj-45-285-i004
Baseline Two months p
Delayed enhancement MDCT
 Infarct size (mL)* 10.4 (2.8-29.6) 15.4 (8.8-24.9) 0.323
Echocardiography
 LV ejection fraction (%) 57.0±10.7 59.2±11.2 0.073
 LVEDD (mm) 49.9±4.8 50.8±4.5 0.272
 LVESD (mm) 34.0±5.2 33.7±5.5 0.690
 LVEDV (mL) 80.6±24.6 90.3±28.7 0.019
 LVESV (mL) 38.5±16.4 39.5±16.2 0.406
 LVEDD index (mm/m2) 30.7±8.4 29.3±3.6 0.706
 LVESD index (mm/m2) 19.3±4.2 19.5±3.8 0.706
 LVEDV index (mL/m2) 44.4±18.8 52.7±16.8 0.022
 LVESV index (mL/m2) 21.3±11.3 22.1±10.5 0.935

*Expressed as median (interquartile range). p values derived from Wilcoxon signed rank test (non-normal distribution) or paired t test (normal distribution). MDCT: multidector computed tomography, LV: left ventricular, LVEDD: left ventricular end-diastolic dimension, LVESD: left ventricular end-systolic dimension, LVEDV: left ventricular end-diastolic volume, LVESV: left ventricular end-systolic volume

Table 5

Correlation between hs-CRP level and indices of infarct size, LV function and volumes

kcj-45-285-i005
hs-CRP
At admission 24 hours Two months
r p r p r p
Peak troponin-I (ng/mL) -0.097 0.473 0.452 0.002 0.015 0.929
Infarct size (mL)
 Baseline 0.075 0.578 0.560 <0.001 0.164 0.318
 2 months -0.095 0.600 0.540 0.004 0.043 0.820
LVEF (%)
 Baseline 0.150 0.266 -0.375 0.010 -0.225 0.168
 2 months 0.009 0.956 -0.429 0.011 -0.076 0.674
LVEDVI (mL/m2)
 Baseline -0.079 0.652 0.021 0.921 -0.110 0.585
 2 months -0.133 0.586 -0.062 0.826 -0.068 0.810
LVESVI (mL/m2)
 Baseline 0.121 0.495 0.096 0.661 0.044 0.830
 2 months 0.160 0.514 0.025 0.930 0.239 0.390

hs-CRP: high-sensitivity C-reactive protein, LV: left ventricular, LVEF: left ventricular ejection fraction, LVEDVI: left ventricular end-diastolic volume index, LVESVI: left ventricular end-systolic volume index

Table 6

Correlation between NT-proBNP level and indices of infarct size, LV function and volumes

kcj-45-285-i006
NT-proBNP
At admission 24 hours Two months
r p r p r p
Peak troponin-I (ng/mL) -0.033 0.803 0.364 0.027 0.592 0.002
Infarct size (mL)
 Baseline 0.096 0.472 0.394 0.016 0.632 0.001
 2 months 0.007 0.969 0.714 <0.001 0.561 0.007
LVEF (%)
 Baseline -0.084 0.533 -0.591 <0.001 -0.641 0.001
 2 months -0.209 0.209 -0.682 <0.001 -0.539 0.010
LVEDVI (mL/m2)
 Baseline -0.066 0.705 0.482 0.017 0.165 0.627
 2 months 0.038 0.880 0.148 0.629 0.796 0.032
LVESVI (mL/m2)
 Baseline -0.064 0.718 0.554 0.006 0.171 0.636
 2 months -0.185 0.463 0.368 0.216 0.831 0.021

NT-proBNP: N-terminal pro-B-type natriuretic peptide, LV: left ventricular, LVEF: left ventricular ejection fraction, LVEDVI: left ventricular end-diastolic volume index, LVESVI: left ventricular end-systolic volume index

Table 7

Infarct size, LV function and volumes according to hs-CRP levels

kcj-45-285-i007
hs-CRP (mg/dL) At admission p 24 hours p 2 months p
≤0.09(n=43) >0.09(n=43) ≤0.98(n=43) >0.98(n=43) ≤0.04(n=43) >0.04(n=43)
Peak troponin-I (ng/mL)* 65 (35-135) 64 (32-105) 0.548 45 (29-98) 98 (58-188) 0.009 72 (24-161) 51 (33-84) 0.566
Infarct size (mL)*
 Baseline 15.2 (3.9-29.5) 9.4 (2.4-38.1) 0.698 8.7 (4.5-23.5) 19.8 (3.0-51.6) 0.085 10.8 (2.4-28.8) 9.5 (3.8-24.5) 0.979
 2 months 16.5 (8.8-27.0) 15.2 (6.3-23.2) 0.256 15.2 (9.4-17.4) 21.1 (8.9-35.4) 0.214 15.9 (8.3-27.5) 13.6 (8.1-18.6) 0.513
LVEF (%)
 Baseline 55.2±11.1 58.3±10.2 0.195 59.3±8.9 53.3±10.1 0.013 60.1±7.8 56.0±12.1 0.142
 2 months 58.3±13.3 59.4±8.6 0.731 61.3±6.2 57.5±8.9 0.120 60.9±7.7 59.1±14.1 0.597
LVEDVI (mL/m2)
 Baseline 45.7±16.0 44.7±20.9 0.856 40.4±17.1 48.9±21.1 0.167 44.1±15.7 45.3±25.8 0.870
 2 months 54.9±11.3 51.0±20.1 0.591 46.8±12.3 60.8±19.4 0.051 54.0±9.4 53.8±22.6 0.972
LVESVI (mL/m2)
 Baseline 21.5±9.9 22.3±12.9 0.591 17.7±7.5 25.1±13.4 0.037 19.6±8.1 23.0±16.0 0.458
 2 months 19.5±8.8 23.9±11.5 0.323 19.3±6.0 26.0±14.2 0.129 19.7±10.0 23.7±12.5 0.462

*Expressed as median (interquartile range). p values derived from Mann-Whitney U test (non-normal distribution) or Student t test (normal distribution). LV: left ventricular, hs-CRP: high-sensitivity C-reactive protein, LVEF: left ventricular ejection fraction, LVEDVI: left ventricular end-diastolic volume index, LVESVI: left ventricular end-systolic volume index

Table 8

Infarct size, LV function and volumes according to NT-proBNP levels

kcj-45-285-i008
NT-proBNP (pg/mL) At admission p 24 hours p Two months p
≤144 (n=43) >144 (n=43) ≤1233 (n=43) >1233 (n=43) ≤262 (n=43) >262 (n=43)
Peak troponin-I (ng/mL)* 55 (35-122) 74 (31-116) 0.978 43 (26-90) 103 (64-199) 0.018 37 (20-75) 75 (45-123) 0.020
Infarct size (mL)*
 Baseline 8.0 (0.9-26.0) 13.2 (6.1-34.6) 0.156 7.4 (1.3-12.2) 25.5 (11.4-55.0) <0.001 7.3 (0.7-10.3) 23.8 (3.0-42.6) 0.019
 2 months 15.0 (8.4-27.0) 16.8 (8.8-24.8) 0.709 10.9 (3.9-15.6) 23.9 (17.1-38.2) 0.014 11.1 (2.7-15.3) 16.4 (10.3-25.5) 0.025
LVEF (%)
 Baseline 59.8±9.6 54.2±11.5 0.018 63.8±6.9 48.8±10.1 <0.001 64.5±6.2 53.6±8.3 <0.001
 2 months 62.3±8.5 56.3±13.1 0.052 62.9±6.5 54.7±8.4 0.002 65.5±5.8 57.8±7.9 0.003
LVEDVI (mL/m2)
 Baseline 42.2±17.1 46.3±20.9 0.467 35.1±21.6 53.7±17.1 0.011 46.9±12.8 47.3±16.1 0.958
 2 months 47.4±13.2 58.7±20.0 0.120 47.9±16.9 54.9±22.1 0.500 48.5±15.8 53.2±15.2 0.646
LVESVI (mL/m2)
 Baseline 19.4±9.2 23.2±13.5 0.265 14.0±9.1 28.4±12.8 0.002 18.9±5.8 22.4±10.3 0.448
 2 months 20.9±6.5 22.7±14.7 0.698 19.9±8.4 26.3±12.4 0.265 18.3±4.1 23.9±9.9 0.371

*Expressed as median (interquartile range). p values derived from Mann-Whitney U test (non-normal distribution) or Student t test (normal distribution). LV: left ventricular, NT-proBNP: N-terminal pro-B-type natriuretic peptide, LVEF: left ventricular ejection fraction, LVEDVI: left ventricular end-diastolic volume index, LVESVI: left ventricular end-systolic volume index

Acknowledgments

This study was supported by a grant from the National Research Foundation of Korea, which is funded by the Korean Government (MEST) (No. 2010-0020261), and the Korean Health Technology R&D Project, and Korea's Ministry of Health & Welfare (HI12C0199, HI13C1527).

Notes

The authors have no financial conflicts of interest.

References

1. Tomoda H, Aoki N. Prognostic value of C-reactive protein levels within six hours after the onset of acute myocardial infarction. Am Heart J. 2000; 140:324–328.
2. Suleiman M, Khatib R, Agmon Y, et al. Early inflammation and risk of long-term development of heart failure and mortality in survivors of acute myocardial infarction predictive role of C-reactive protein. J Am Coll Cardiol. 2006; 47:962–968.
3. Ohlmann P, Jaquemin L, Morel O, et al. Prognostic value of C-reactive protein and cardiac troponin I in primary percutaneous interventions for ST-elevation myocardial infarction. Am Heart J. 2006; 152:1161–1167.
4. Suleiman M, Aronson D, Reisner SA, et al. Admission C-reactive protein levels and 30-day mortality in patients with acute myocardial infarction. Am J Med. 2003; 115:695–701.
5. Mega JL, Morrow DA, De Lemos JA, et al. B-type natriuretic peptide at presentation and prognosis in patients with ST-segment elevation myocardial infarction: an ENTIRE-TIMI-23 substudy. J Am Coll Cardiol. 2004; 44:335–339.
6. Kwon TG, Bae JH, Jeong MH, et al. N-terminal pro-B-type natriuretic peptide is associated with adverse short-term clinical outcomes in patients with acute ST-elevation myocardial infarction underwent primary percutaneous coronary intervention. Int J Cardiol. 2009; 133:173–178.
7. Richards AM, Nicholls MG, Espiner EA, et al. B-type natriuretic peptides and ejection fraction for prognosis after myocardial infarction. Circulation. 2003; 107:2786–2792.
8. Suzuki S, Yoshimura M, Nakayama M, et al. Plasma level of B-type natriuretic peptide as a prognostic marker after acute myocardial infarction: a long-term follow-up analysis. Circulation. 2004; 110:1387–1391.
9. James SK, Lindahl B, Siegbahn A, et al. N-terminal pro-brain natriuretic peptide and other risk markers for the separate prediction of mortality and subsequent myocardial infarction in patients with unstable coronary artery disease: a Global Utilization of Strategies To Open occluded arteries (GUSTO)-IV substudy. Circulation. 2003; 108:275–281.
10. Khan SQ, Quinn P, Davies JE, Ng LL. N-terminal pro-B-type natriuretic peptide is better than TIMI risk score at predicting death after acute myocardial infarction. Heart. 2008; 94:40–43.
11. Anzai T, Yoshikawa T, Shiraki H, et al. C-reactive protein as a predictor of infarct expansion and cardiac rupture after a first Q-wave acute myocardial infarction. Circulation. 1997; 96:778–784.
12. Uehara K, Nomura M, Ozaki Y, et al. High-sensitivity C-reactive protein and left ventricular remodeling in patients with acute myocardial infarction. Heart Vessels. 2003; 18:67–74.
13. Nagaya N, Nishikimi T, Goto Y, et al. Plasma brain natriuretic peptide is a biochemical marker for the prediction of progressive ventricular remodeling after acute myocardial infarction. Am Heart J. 1998; 135:21–28.
14. Xiaozhou H, Jie Z, Li Z, Liyan C. Predictive value of the serum level of N-terminal pro-brain natriuretic peptide and high-sensitivity C-reactive protein in left ventricular remodeling after acute myocardial infarction. J Clin Lab Anal. 2006; 20:19–22.
15. Sim DS, Ahn Y, Kim YH, et al. Effect of manual thrombus aspiration during primary percutaneous coronary intervention on infarct size: evaluation with cardiac computed tomography. Int J Cardiol. 2013; 168:4328–4330.
16. Kushner FG, Hand M, Smith SC Jr, et al. 2009 focused updates: ACC/AHA guidelines for the management of patients with ST-elevation myocardial infarction (updating the 2004 guideline and 2007 focused update) and ACC/AHA/SCAI gidelines on percutaneous coronary intervention (updating the 2005 guideline and 2007 focused update): a report of the American College of Cardiology Foundation/American Heart Association task force on practice guidelines. Circulation. 2009; 120:2271–2306.
17. TIMI Study Group. The Thrombolysis in Myocardial Infarction (TIMI) trial. Phase I findings. N Engl J Med. 1985; 312:932–936.
18. Gibson CM, Schömig A. Coronary and myocardial angiography: angiographic assessment of both epicardial and myocardial perfusion. Circulation. 2004; 109:3096–3105.
19. van't Hof AW, Liem A, Suryapranata H, Hoorntje JC, de Boer MJ, Zijlstra F. Angiographic assessment of myocardial reperfusion in patients treated with primary angioplasty for acute myocardial infarction: myocardial blush grade. Zwolle Myocardial Infarction Study Group. Circulation. 1998; 97:2302–2306.
20. van't Hof AW, Liem A, de Boer MJ, Zijlstra F. Clinical value of 12-lead electrocardiogram after successful reperfusion therapy for acute myocardial infarction. Zwolle Myocardial infarction Study Group. Lancet. 1997; 350:615–619.
21. Boussel L, Ribagnac M, Bonnefoy E, et al. Assessment of acute myocardial infarction using MDCT after percutaneous coronary intervention: comparison with MRI. AJR Am J Roentgenol. 2008; 191:441–447.
22. Rodriguez-Granillo GA, Rosales MA, Baum S, et al. Early assessment of myocardial viability by the use of delayed enhancement computed tomography after primary percutaneous coronary intervention. JACC Cardiovasc Imaging. 2009; 2:1072–1081.
23. Bolognese L, Cerisano G, Buonamici P, et al. Influence of infarct-zone viability on left ventricular remodeling after acute myocardial infarction. Circulation. 1997; 96:3353–3359.
24. Ibrahim T, Hackl T, Nekolla SG, et al. Acute myocardial infarction: serial cardiac MR imaging shows a decrease in delayed enhancement of the myocardium during the 1st week after reperfusion. Radiology. 2010; 254:88–97.
25. Sato A, Nozato T, Hikita H, et al. Prognostic value of myocardial contrast delayed enhancement with 64-slice multidetector computed tomography after acute myocardial infarction. J Am Coll Cardiol. 2012; 59:730–738.
26. Ørn S, Manhenke C, Ueland T, et al. C-reactive protein, infarct size, microvascular obstruction, and left-ventricular remodelling following acute myocardial infarction. Eur Heart J. 2009; 30:1180–1186.
27. Harb TS, Zareba W, Moss AJ, et al. Association of C-reactive protein and serum amyloid A with recurrent coronary events in stable patients after healing of acute myocardial infarction. Am J Cardiol. 2002; 89:216–221.
28. Morita E, Yasue H, Yoshimura M, et al. Increased plasma levels of brain natriuretic peptide in patients with acute myocardial infarction. Circulation. 1993; 88:82–91.
29. Sadanandan S, Cannon CP, Chekuri K, et al. Association of elevated B-type natriuretic peptide levels with angiographic findings among patients with unstable angina and non-ST-segment elevation myocardial infarction. J Am Coll Cardiol. 2004; 44:564–568.
30. Mayr A, Mair J, Schocke M, et al. Predictive value of NT-pro BNP after acute myocardial infarction: relation with acute and chronic infarct size and myocardial function. Int J Cardiol. 2011; 147:118–123.
TOOLS
Similar articles