

 PDF
PDF ePub
ePub Citation
 Print
Print


Introduction
Acute myocardial infarction is the main cause of death in patients with ischemic heart disease, which is the third most frequent cause of death in Korea. Opening an occluded coronary artery as soon as possible to resume blood flow is the main treatment issue for patients undergoing acute myocardial infarction. However, the infarcted myocardium is not only injured by ischemia but by reperfusion.1) Therefore, drugs and manipulations that reduce the myocardial damage during reperfusion have been developed. Several pre and post-conditioning manipulations before and after reperfusion have been developed to prevent opening of the mitochondrial permeability transition pores (mPTPs).2)3)
Several studies have shown the protective effects of a glucose-insulin-potassium (GIK) solution for pre-conditioning.4) The concept of modulating metabolism during a ST-segment elevation myocardial infarction (STEMI) with a GIK solution was proposed by Sodi-Pallares in 1962.5) The solution was originally formulated to optimize potassium flux in the ischemic myocardium and augment potassium handling. This solution is a simple, low-cost, and widely practical therapy and has demonstrated favorable effects for rapid and complete resolution of ST segment shifts, fewer arrhythmias, smaller infarct sizes, and reduced circulating free fatty acids.6)7)8) A GIK solution may reduce mortality through several mechanisms.6) High-dose glucose improves myocardial energy production efficiency during acute ischemia by becoming the preferred fuel for the heart.6)9) Because intracellular potassium levels are depleted during ischemia, providing exogenous potassium increases its concentration within myocytes, thereby raising the threshold for ventricular arrhythmia.8)10) Exogenous insulin suppresses circulating levels and myocardial uptake of free fatty acids, which are toxic to ischemic myocardium.7)8)9)10)11) Evidence indicates that insulin reduces ischemic damage by suppressing reactive oxygen species (ROS) and consequent increased lipid peroxidation during myocardial ischemia/reperfusion (I/R) injury.12) The effects of the GIK solution in clinical applications remain controversial. Conflicting data exist on the effects of GIK solution to treat STEMI. High-dose GIK solution therapy (25% glucose, 50 IU soluble insulin/L, and 80 mmol potassium chloride/L at 1 mL/kg/hr over 24 hours), used as an adjunct to thrombolytic therapy (1.5 MU streptokinase at 30 to 60 min), is safe, improves clinical 1-month outcomes, and the beneficial effect was maintained for 1 year in a prospective, randomized trial.13) In addition, a meta-analysis of 16 trials of GIK solution vs control involving almost 5,000 patients indicated a reduction (18%) in mortality risk in patients who received GIK solution infusion therapy with wide confidence intervals.14) The benefit appeared to be larger in trials that tested a high-dose GIK infusion regimen. However, a large scale, randomized trial showed no beneficial effect of the GIK solution in patients with STEMI. High-dose GIK infusion in patients with STEMI in the Clinical Trial of MEtabolic Modulation in Acute Myocardial Infarction Treatment Evaluation-Estudios Cardiologicos Latinoamerica (CREATE-ECLA) study15) with 20,201 patients showed no differences in mortality, cardiac arrest, or cardiogenic shock. High dose GIK therapy offers no clinical benefit at 1 year in patients with STEMI without signs of heart failure treated with reperfusion therapy.16) The Organization for the Assessment of Strategies for Ischemic Syndromes 6 GIK and CREATE-ECLA GIK trials in patients with STEMI showed no favorable clinical effects.17)
Post-translational protein modification by N-acetylglucosamine (GlcNAc) on serine or threonine residues called O-GlcNAcylation18) is an important mechanism to protect the myocardium. Diverse stressors (heat shock, ethanol, ultraviolet ray, hypoxia, reduction, oxidation, and osmotic stress) induce a rapid and global increase in O,N-acetylglucosamine (O-GlcNAc) level, which augments stress tolerance.19) Howell et al.20) reported that GIK treatment is associated with a significant increase in O-GlcNAcylation in the Hypertrophy, Insulin, Glucose and Electrolytes (HINGE) trial, at least partially explaining the beneficial effects of GIK solution.
Despite evidence for the protective effects of the GIK solution in vivo, studies on the cell and molecular mechanisms of the GIK solution are very limited. In this study used an in vitro neonatal rat ventricular myocyte (NRVM) culture and coverslip I/R model21) to investigate the effects of GIK solution on the attenuation of apoptosis, ROS production, and O-GlcNAcylation.
Materials and Methods
Isolation and culture of NRVMs
NRVMs were isolated by standard methods22) and plated in wells of culture plates. Hearts of six to eight postnatal day 3-4 Sprague-Dawley rat pups were dissected and placed in cold Hank's Balanced Salt Solution (HBSS) without Ca2+ and Mg2+ (Invitrogen, Carlsbad, CA, USA). The ventricles were excised and finely (1-2 mm) minced. The minced tissue was dissociated in trypsin-EDTA solution {0.05% (w/v), Invitrogen} containing 0.01% (w/v) DNase I (Roche, Mannheim, Germany) for 5 min with constant stirring at 37℃. After brief centrifugation (1,000 rpm, 5 min in a serology centrifuge), fresh trypsin-EDTA solution was added to the pellet, and the dissociation was repeated. Trypsin activity was inhibited by adding the same volume of a trypsin inhibitor solution (0.1 mg/mL culture medium; Sigma, St. Louis, MO, USA) containing 10% fetal bovine serum (FBS). After a brief centrifugation, the supernatant was collected, and the pellet was resuspended in warm culture medium. This dissociation process was repeated four times. The dissociated cells were transferred to a 6-well culture plate and incubated for 1.0-1.5 hr at 37℃ in a humidified atmosphere (5% CO2) to allow the non-myocardiocytes to attach. The suspended myocytes were collected by centrifugation, counted, and plated at a density of ~800 cells/mm with new culture medium containing 0.1 mM 5-bromouridine (Sigma, St Louis, MO, USA) overnight. The culture medium was replaced the next day with fresh medium without 5-bromouridine. The plating medium was Dulbeco's modified Eagle's medium with 25 mM high glucose (4.5 g/L; Invitrogen) containing 10% FBS and penicillin/streptomycin (10,000 U/mL penicillin and 10,000 µg/mL streptomycin; Invitrogen). The potassium chloride (KCl) concentration was 0.4 g/L (5.33 mM). The medium was completely changed to fresh every other day.
ROS detection
Cells (day 7 in vitro) were covered with a coverslip for 3 hr. The cells were reperfused for 30 min by uncovering the coverslip. After a brief rinse with HBSS, the cells were stained with 10 µM 2',7'-dihydrodichlorofluorescin diacetate (H2DCF-DA, Sigma, St Louis, MO, USA) for 10 min in an incubator. After rinsing, green fluorescence images were acquired using a Leica DM IRE2 microscope (Leica Microsystems AG, Wetzlar, Germany).
Detection of apoptotic cells
After rinsing the cells with Dulbecco's phosphate buffered saline (D-PBS), they were incubated with Alexa Fluor® 488-conjugated Annexin V (AV) (Invitrogen) and 100 µg/mL propidium iodide (PI; Sigma) for 15 min at room temperature. The cells were rinsed briefly with D-PBS and phase-contrast and fluorescent images in the green (for AV) or red (for PI) channel were obtained using the Leica microscope.
Immunocytochemistry (ICC)
Cells grown on the bottom of culture wells were stained directly. The cells were rinsed briefly in D-PBS and fixed using a sequential paraformaldehyde/methanol fixation procedure {incubation in 4% paraformaldehyde in PBS (20 mM sodium phosphate buffer, pH 7.4, 0.9% NaCl) at room temperature for 10 min followed by incubation in methanol at -20℃ for 20 min}.23) The cells were incubated overnight at 4℃ in preblocking buffer (5% normal goat serum, 0.05% Triton X-100, and 450 mM NaCl in 20 mM sodium phosphate buffer, pH 7.4). Primary antibodies {mouse monoclonal anti-GlcNAc (1:1000; ABR Bioreagents, Golden, CO, USA), and rabbit anti-OGT (O-GlcNAc transferase, 1:500; ProteinTech Group, Inc, Chicago, IL, USA} were added to the wells and incubated overnight at 4℃. The cells were rinsed (3×15 min in preblocking buffer) and incubated with secondary antibodies {Alexa Fluor 488-conjugated goat anti-mouse and Alexa Fluor 568-conjugated goat anti-rabbit immunoglobulin G (each diluted 1:1,000 in blocking buffer; Invitrogen)} at room temperature for 1-2 hr. The cells were rinsed once in preblocking buffer for 15 min, twice in D-PBS, and a mounting solution (4% N-propylgallate in 90% glycerol and 10% sodium carbonate buffer, pH 8.7) was added to cover the bottom of the well.
Image acquisition and densitometry
The Leica microscope equipped with I3 S, N2.1 S, and Y5 filter systems was used for phase-contrast and epifluorescence microscopy. Images (1388×1039 pixels) were acquired with a high-resolution CoolSNAP™ CCD camera (Photometrics Inc., Tucson, AZ, USA) using Leica FW4000 software. Live images were videotaped using Ancamcorder ver. 1.4 (EbizNetworks, Seoul, Korea). Fluorescence images were converted to black and white for ROS densitometry and ICC signal strength measurements, and the images were inverted so that higher expression was darker (0-255 scale) using a Adobe Photoshop 7.0 software (Adobe Systems, San Jose, CA, USA). Signal density (10-20 cells) was measured using the NIH Image J program ver. 1.45 (NIH, Bethesda, MD, USA).
Statistical analysis
The percentage of PI(+) cells was calculated by manual counting and expressed as % of total (mean±standard deviation). Multiple pairwise comparisons were evaluated using the Kruskal-Wallis one-way analysis of variance, and the differences between groups were identified using the Mann-Whitney U test. p values <0.05 were considered significant. All statistical analyses were conducted using SPSS ver. 20.0 (SPSS Inc., Chicago, IL, USA).
Results
General characteristics of the cultured NRVM
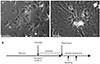
Suspensions of dissociated NRVM were completely separated. The dissociated NRVM cells were seeded on the bottom of culture wells in high glucose (4.5 g/L) medium. The cells were confluent within 1 week after seeding (Fig. 1A). From this stage, the cells beat synchronously at rates of 80-140 beats/min. We carried out all experiments when the cultures reached confluence (Fig. 1A). Ischemia was induced by placing a coverslip directly on the culture well. Just before uncovering the plate, the medium was changed with fresh, and reperfusion began by removing the coverslip. We did not vary the KCl concentration because NRVM cells in our I/R model respond very sensitively to changes in the KCl concentration, resulting in uncontrollable changes in beating and cell death (our observations).
Establishment of the in vitro coverslip I/R model
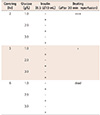
Considering the limited cell number obtained per dissection, we used a 24-well culture plate and 12-mm diameter coverslips to minimize the number of cells required. The diameter of a well on a 24-well culture plate is 15.5 mm. We placed coverslips toward the longer side of the plate by briefly tilting the plate when the coverslips were placed the first time, so cells on the opposite side were not covered by the coverslip. The uncovered area served as a control against the covered area. As the cover restricted nutrient and oxygen diffusion, the central one-third along the radius was defined as the "core", the middle as the "penumbra", and the outermost one-third as the "periphery". Covering the cells for 6 hr was too harsh, resulting in cell death in the core region, regardless of the glucose and insulin concentrations, whereas 2 hr was insufficient cell beating recovered immediately after reperfusion. The core region resumed beating within 3 hr of reperfusion when the cells were covered for 3 hr (Table 1). Therefore, the following experiments were performed using our model (Fig. 1B).
Effects of glucose and insulin on apoptosis
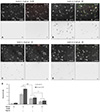
To determine the protective effects of glucose and insulin on NRVM in the in vitro I/R model, the cells were covered with a coverslip for 3 hr to induce ischemia, and the medium was replaced with fresh containing the indicated insulin and glucose concentrations immediately prior to uncovering the plate (i.e., reperfusion). After 30 min of reperfusion, the cells were stained with AV and PI. The phase-contrast, AV- and PI-stained, and merged images of the cells in the ischemic core region are shown in Fig. 2A to D. The AV and PI fluorescence images revealed that the numbers of early {i.e., AV(+)/PI(-)} and late apoptotic {i.e., AV(+)/PI(+)} cells increased significantly when the cells were reperfused in insulin(-)/low (1.0 g/L) glucose medium (Fig. 2B). The numbers of AV(+)/PI(-) and AV(+)/PI(+) cells decreased significantly (p<0.001) when a higher glucose solution was added to the perfusion medium (Fig. 2C), and a further reduction in number was seen when insulin (0.5/dL) was added to the wells (p<0.01) (Fig. 2D). These results indicate that the protective effects of glucose and insulin are additive and/or synergistic (Fig. 2E).
Effects of insulin and glucose on ROS expression
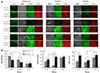
Cellular damage by ROS is a major cause of apoptosis in the I/R model. Therefore, we investigated the effects of the GIK solution on ROS production using H2DCF-DA (Sigma, St Louis, MO, USA) staining. The ROS level in the core region was very high {Fig. 3A, ischemic core, ROS(-) insulin/1.0 g/L glucose}, indicating that the cells in this region were under high stress due to the I/R shock. A higher glucose concentration (2.0 g/L) in the perfusion media decreased the ROS level significantly in the core region compared to the effect of 1.0 g/L glucose medium {Fig. 3A, ischemic core, ROS; Fig. 3B-a, insulin(-)}. A higher glucose concentration (3.0 g/L) did not lower ROS {Fig. 3A, ischemic core, ROS; Fig. 3B-a, insulin(-)}. Adding insulin (0.5 U/dL) to the perfusion medium significantly lowered ROS levels compared to those in the corresponding insulin(-) medium with the same glucose (1.0 or 2.0 g/L) concentrations {Fig. 3B-a, insulin(+)}. Similar to the insulin(-) perfusion medium, the higher (2.0 g/L) glucose concentration further suppressed the ROS level, but higher (3.0 g/L) glucose had no additional effect on ROS {Fig. 3B-a, insulin(+)}. These results indicate that glucose and insulin suppress ROS production in our I/R model.
Effects of insulin and glucose on O-GlcNAc and OGT expression
Next, we investigated the effects of the GIK solution on O-GlcNAcylation. We performed ICC to stain the cells with antibodies against O-GlcNAc or OGT, which transfers the GlcNAc moiety to the -OH group of serine or threonine residues in proteins. The cells in our model system were covered for 3 hr. After a 30 min reperfusion, the cells were double-labeled with anti-GlcNAc and -OGT antibodies. The phase-contrast and ICC images of the cells in the three regions are shown in Fig. 3A. In general, adding insulin (0.5 U/dL) and glucose to the perfusion medium upregulated O-GlcNAc and OGT expression compared to that in the corresponding cultures perfused in insulin(-) medium. However, the O-GlcNAc and OGT expression levels were not concentration-dependent. When insulin was not included in the perfusion medium, the higher (2.0 g/L) glucose concentration significantly lowered the O-GlcNAc level {Fig. 3B-b, insulin(-)} but had no effect on the OGT level {Fig. 3B-c, insulin(-)}. In contrast, higher (3.0 g/L) glucose significantly increased both O-GlcNAc and OGT levels {Fig. 3B-b and c; insulin(-)}. When insulin (0.5 U/dL) was present in the perfusion medium, the higher concentration (2.0 g/L) of glucose significantly increased the expression of O-GlcNAc (Fig. 3B-b) but decreased OGT expression (Fig. 3B-c), compared to that in cells in the lower (1.0 g/L) glucose concentration. Adding more (3.0 g/L) glucose to the perfusion medium significantly upregulated O-GlcNAc (Fig. 3B-b), but the increase was not different from that caused by adding 2.0 g/L glucose. OGT expression increased significantly in this glucose concentration compared to from in 2.0 g/L glucose, but the level was comparable to that found in the low (1.0 g/L) glucose solution (Fig. 3B-c). These results indicate that the GIK solution generally upregulates O-GlcNAcylation but the effect could be reversed depending on the cell environmental milieu.
Discussion
We established an in vitro coverslip I/R model of NRVM and tested the efficacy of the GIK solution. Our results show that glucose and insulin reduced the intensity and number of ROS(+) cells and upregulated GlcNAc and OGT expression, which prevented apoptosis. The effects of glucose and insulin were additive or synergistic.
Our results indicate the beneficial effects of GIK at the cellular level in an in vitro I/R model of NRVM. Our culture system has benefits over in vivo experiments in the time required and convenience. The coverslip NRVM I/R model was designed in 2004 by Pitts et al.21) However, the model requires modification before being applied in other laboratories. Setting up the coverslip I/R model was tricky. For example, we initially placed 18-mm diameter coverslips on NRVM monolayers for 24 hr in 12-well culture plates. Surprisingly, this resulted in total death of the cells in the core region, indicating that conditions for the coverslip I/R model vary drastically depending on the culture well and coverslip sizes. After repeated trials, we determined the adequate duration for the cover (~7 hr), and the core region recovered from shock and resumed beating at a normal rate. One drawback of the 12-well/15-mm diameter coverslip model was that it required more cells/well. This decreased the number of wells that could be prepared for one NRVM cycle. Therefore, we switched to a 24-well/12-mm diameter model, which provided a greater number of wells for experiments. In this relatively small sized well, even a cover for 6 hr was too harsh, and all cells in the core region died. After many trials, we set the cover duration to 3 hr, which resulted in adequate shock to the NRVMs, and the cells resumed beating within 30 min after reperfusion. This model was used for all experiments.
Our results show that glucose and insulin suppressed ROS production in the present I/R model. Previous studies have shown that the GIK solution shifts myocardial energy metabolism from long-chain fatty acids toward glucose as a fuel.24) When cells are incubated in the GIK solution, glucose uptake increases significantly through glucose transporters (GLUT)-1 and -4 under hypoxic conditons.25) Glucose uptake is facilitated by insulin, which recruits GLUT-1 and GLUT-4 transporters from intracellular sites to the cell membrane.26) Degradation of glucose to CO2 produces NADH in the cytosolic space (glycolysis), which increases the cytosolic NADH/NAD+ ratio. This high amount of cytosolic reduced equivalent enters the mitochondria and increase glutathione peroxidase activity. The overall result improves ROS scavenging activity by the mitochondria.
Our ICC results show that insulin and high glucose increased GlcNAc and OGT expression, which benefits cell survival.19) The HINGE trial showed that GIK treatment significantly increases O-GlcNAc in the heart ventricles.20) Previous studies have shown that increased O-GlcNAc protein levels increase cell survival following stress.27) Treating cells with glucosamine, high levels of glucose, or O-(2-acetamido-2-deoxy-D-glucopyranosylidene)-amino-N-phenylcarbamate (PUGNAc), an O-GlcNAcase inhibitor, significantly increases O-GlcNAc levels and improves cell viability.28) Alloxan and azaserine, O-GlcNAc transferase and glucose metabolic inhibitors, respectively, exacerbate I/R injury.28) These findings support that an increase in O-GlcNAc level is an endogenous stress-activated response. Augmentation of this response by GIK could improve cell survival.
The O-GlcNAc modification on the mitochondrial voltage-dependent anion channel (VDAC) may represent a unique mechanism of cytoprotection.29) Activation of the mPTP is a critical step in the mitochondrial-mediated death pathway. VDAC has been widely recognized as a putative component, or at least a modulator of mPTP. Augmented O-GlcNAc levels via OGT overexpression or inhibited O-GlcNAcase (with PUGNAc or small interfering RNA) preserves the post-hypoxic mitochondrial membrane potential.29)30) Myocardial ischemia induces mitochondrial Ca2+ overload and generates ROS, with subsequent formation of mPTP. mPTP causes loss of the mitochondrial membrane potential, leading to cytochrome c release. Augmenting the O-GlcNAc level may attenuate ischemia-induced Ca2+ overload, ROS generation, and subsequent mPTP formation. Our results provide in vitro evidence that O-GlcNAc is upregulated by GIK. Further studies are necessary to determine the potential mechanism and signaling pathways that lead O-GlcNAc to cytoprotection.
 XML Download