

 PDF
PDF ePub
ePub Citation
 Print
Print


Introduction
Diseases of circulatory system, in particular cardiovascular diseases, have been the leading cause of death worldwide for many years.1) At the beginning of the 20th century, cardiovascular diseases accounted for less than 10% of all deaths worldwide. Now, early in the 21st century, they account for nearly one half of all deaths in the developed world and 25% in the developing world.2) In Korea, cerebrovascular and cardiovascular diseases rank first and second for mortality from single-organ diseases.3) An understanding of cardiovascular disease mortality patterns can be gained from analyzing national data representative of the population, and may be important in developing strategies for reducing mortality from cardiovascular diseases. Cardiovascular disease trends have been reported in many countries. However, there is only limited information on the trends of mortality from cardiovascular diseases in the Korean population. Thus, we examined the changing pattern of cardiovascular disease mortality in Korea during a 30-year period using Cause of Death statistics from Statistics Korea.4)
Materials and Methods
Annual mortality data were obtained from Korean Statistical Information Service managed by Statistics Korea (formerly known as Korea National Statistical Office). Mortality statistics with cause of death information were available from 1983 to 2012. Causes of death were coded according to the International Classification of Disease, 10th Revision. For the purpose of this study, one category was analyzed for circulatory system diseases. For cardiovascular diseases, five categories were used: total heart diseases (I00-13 and I20-51), acute rheumatic fever and chronic rheumatic heart disease (I00-I09), hypertensive heart disease (I10-I13), ischemic heart disease (IHD, I20-I25), and atherosclerosis of arteries other than carotid or cerebral artery (I70) (Table 1).
The total heart diseases category (I26-I51) includes acute and chronic rheumatic heart disease, hypertensive heart disease, ischemic heart disease and other heart diseases. Acute rheumatic fever and chronic rheumatic heart diseases (I00-I09) includes rheumatic fever without mention of heart involvement (I00), rheumatic fever with heart involvement (I01), rheumatic chorea (I02), rheumatic mitral valve diseases (I05), rheumatic aortic valve diseases (I06), rheumatic tricuspid valve diseases (I07), multiple valve diseases (I08), and other rheumatic heart diseases (I09). Hypertensive heart disease (I10-I13) includes essential primary hypertension (I10), hypertensive heart disease (I11), hypertensive renal disease (I12), and hypertensive heart and renal disease (I13). The ischemic heart diseases category (I20-I25) includes angina pectoris (I20), acute myocardial infarction (I21), subsequent myocardial infarction (I22), certain current complications following acute myocardial infarction (I23), other acute ischemic heart diseases (I24), and chronic ischemic heart disease (I25). Atherosclerosis (I70) includes atherosclerosis of the aorta (I70.0), atherosclerosis of the renal artery (I70.1), atherosclerosis of arteries of the extremities (I70.2), atherosclerosis of other arteries (I70.8), and generalized and unspecified atherosclerosis (I70.9).
We calculated the age-adjusted mortality rate for cardiovascular disease using the direct standardization method, with the age distribution in 2000 used as the standard population. We analyzed data with 10-year age intervals and used the same population structure for standardization in men and women to compare mortality by sex. We also presented penalized B-splines to explore the patterns of the crude death rate and age-adjusted death rate per 100000. Penalized regression methods were used that use a suitable penalty functional to quantify the notion of roughness of a curve, with a necessary compromise between bias and variability in curve fitting.5)
Results
Mortality from diseases of circulatory system
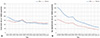
Over the last 30 years, the crude mortality rate from diseases of the circulatory system has shown little change. By 1992, the crude mortality rate for men was higher than for women, but this gender gap gradually decreased, and post-1992 the mortality rate has been higher for women. The crude mortality rate from circulatory system diseases was 187.0 per 100000 men and 144.5 per 100000 women in 1983. The rate has decreased to 110.4 per 100000 men and 123.8 per 100000 women in 2012. The mortality rate has seen a 41.3% decrease in men and 14.3% decrease in women during the 30 years (Fig.1A).
The age-adjusted mortality rate has also decreased, but the rate has consistently been higher in men than in women. In 1983, the age-adjusted mortality rate from circulatory system diseases was 305.7 per 100000 men and 160.4 per 100000 women. The age-adjusted mortality rate per 100000 was 65.7 for men (decreased by 78.5%) and 38.0 for women (decreased by 76.3%) in 2012 (Fig. 1B).
Mortality from total heart diseases
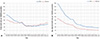
The crude mortality rate from heart disease showed a downward trend up to the early 2000s, but thereafter showed a slight upward trend. In the 1980s, the crude mortality rate for men was higher than for women, but the gender difference gradually decreased and eventually reversed by the 2000s. The crude mortality rate from heart disease in 1983 was 110.2 per 100000 in men and 80.1 per 100000 women. By 2012, the crude mortality rate per 100000 was 58.5 for men and 68.3 for women. During this 30-year period there has been a 46.9% decrease in men and 14.7% decrease in women (Fig. 2A).
The age-adjusted mortality rate consistently decreased in both men and women. The age-adjusted mortality rate rapidly decreased until the early 2000s, and has stabilized thereafter in both sexes. Unlike crude mortality, the age-adjusted heart disease mortality rate has been consistently higher in men than in women. The age-adjusted mortality rate per 100000 from heart disease in 1983 was 175.5 for men and 89.2 for women. In 2012, the age-adjusted mortality rate per 100000 was 35.3 for men and 20.0 for women. Therefore the rate saw a 79.9% decrease in men and a 77.6% decrease in women over the 30-year period (Fig. 2B).
Mortality from IHD
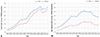
There was a significant increase in IHD mortality over the 30-year period analyzed in this study. The crude IHD mortality rate rapidly increased until the mid-2000s and fluctuated thereafter in both sexes. The crude mortality rate was 3.0 per 100000 in 1983 and 30.6 per 100000 in 2012 in men. In women, the rate was 1.6 per 100000 in 1983 and 27.3 per 100000 in 2012 (Fig. 3A). The age-adjusted mortality rate increased until the early 2000s, after which there was a gradual decrease amongst both sexes. The age-adjusted mortality rate per 100000 in 1983 was 4.7 for men and 1.9 for women. In 2012, the age-adjusted mortality rate per 100000 was 18.4 for men and 8.1 for women. From the time of the highest age-adjusted mortality rates in 2002, there was about a 30% decrease in men and a 37% decrease in women until 2012 (Fig. 3B). During the entire period, the male-to-female ratio for crude IHD mortality was relatively small but the ratio was around 2.0 for age-adjusted IHD mortality (Fig. 3).
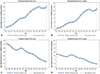
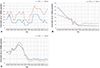
We displayed fitted lines with confidence limits for crude and age-adjusted IHD mortalities, separately for men and women, using a penalized B-splines method. We also presented vertical reference lines that indicate the peaks of each fitted death rate. Although crude IHD mortality showed fluctuations after the mid-2000s, the estimated peak IHD mortality was observed in the last year of observation (2012) (Fig. 4A and B). In contrast, age-adjusted IHD mortality reached its peak in 2002 in men and 2003 in women, after which there was a decreasing pattern in both sexes (Fig. 4C and D). Results of penalized regression splines for other cardiovascular diseases are provided as supplemental data (Supplementary Figs. 1, 2, 3, 4, 5).
Mortality from rheumatic heart disease, hypertensive heart disease, and atherosclerosis
Crude mortality rates from acute rheumatic fever or chronic rheumatic heart disease showed fluctuations, but the rates did not exceed 1.0 per 100000 population. The rates for women were slightly higher than for men overall (Fig. 5A). Deaths from hypertensive diseases rapidly decreased during the 1980s, and have gradually stabilized since the 1990s. The crude mortality was as high as 57.4 per 100000 men and 37.0 per 100000 women in 1983, but subsequently decreased by around by 90% in men and by 60% in women (Fig. 5B). The crude mortality rate from atherosclerosis showed a rapid increase until the early 1990s, then a rapid decrease until the late 1990s, and finally leveled off in the 2000s (Fig. 5C).
Discussion
Our study reports the deaths rates of major cardiovascular diseases in the Korean population and their trends over a 30-year period (1983 until 2012). Mortality from diseases of the circulatory system significantly decreased during this period and the decreasing trend was more prominent in men than in women. Heart disease mortality also showed a marked decrease.
Our study also indicates a decreasing trend in mortality from hypertensive disease. The decrease in hypertensive disease mortality could be largely attributed to improved management of hypertension. Although the prevalence of hypertension did not significantly change, the age-adjusted prevalence of hypertension and the mean blood pressure level among Korean adults have significantly decreased over the last few decades.6)7)
On the other hand, IHD mortality increased remarkably. During the most recent few years of observation, IHD mortality did not significantly increase, but it did not decrease either. In our further analysis with penalized regression splines, the highest IHD mortality was observed in the last year of observation. This implies that the crude mortality rate of IHD is still increasing. The Korean population is expected to face an increasing disease burden from IHD, even though the IHD mortality in Korea is still lower than those of people in Western countries.8)9)
Fortunately, age-standardized mortality from IHD showed a decrease during the last 10 years in our study. Thus, the increase in the absolute number of deaths from IHD can be largely explained by the rapid aging of the Korean population.
Decreasing trends of IHD mortality have been reported in many high-income countries.10,11,12,13) Studies for those countries suggest that even modest changes in major population risk factors such as smoking, hypertension, and lipid levels have had the greatest effect in decreasing cardiovascular mortality. However, increasing rates of obesity, diabetes, and sedentary lifestyles threaten to undermine these trends.14)15)
The decreasing trends of cardiovascular disease mortality may be attributed to lifestyle changes that affect the risk of cardiovascular disease.16) In general, risk factors for cardiovascular disease include demographic characteristics, family history of cardiovascular disease, cigarette smoking, physical inactivity, abnormal serum lipids, obesity, hypertension, and diabetes mellitus.17) A recent study has reported trends in the prevalence of major risk factors for cardiovascular disease using data from the Korea National Health Nutrition Examination Survey for years 1998 through 2012.6) In this study, the prevalence of hypertension decreased in both men and women, whereas the prevalence of hypercholesterolemia significantly increased in both men and women. Smoking rates decreased only in men, whereas the prevalence of diabetes did not change over time. The prevalence of obesity significantly increased only in men.6) In the United States, the mortality from coronary heart disease in men aged 25-44 in the United States continuously decreased during 1985 through 1992.16) The decline of coronary heart disease was attributed to treatments (47%) and changes in risk factors (44%), including reductions in total cholesterol, systolic blood pressure, smoking prevalence, and physical inactivity. In another study of the United States, from 1980 through 2000 the age-adjusted death rate for coronary heart disease decreased significantly among adults 25 to 84 years old.11)
The trends in incidence rates of cardiovascular disease have been studied in many countries other than Korea. In the Unites states, from 1987 to 1994, the incidence of those hospitalized for myocardial infarction showed either stable or slightly increasing trends.18) However, there were significant annual decreases in mortality from coronary heart disease. It was suggested that the decline in mortality for myocardial infarction might be due largely to improvements in the treatment and secondary prevention of myocardial infarction. In Japan, a country geographically close to Korea, the MIYAGI-AMI Registry Study also reported a steady trend of increasing incidence, but decreasing mortality, for acute myocardial infarction from 1979 to 2008.19) In a Korean study of incidence trends from acute myocardial infarction using the Korean National Health Insurance database, incidence of acute myocardial infarction increased between 1997 and 2007.20) However, in contrast to this, another study that analyzed National Health Insurance claim data reported that both crude and age-standardized incidence rates of acute myocardial infarction decreased between 2006 and 2010.21) Considering previous studies and our study, the current decline or stable trend in IHD mortality may be due largely to improvements in treatment of myocardial infarction and to secondary prevention rather than to a decline of incidence rates. Future efforts to reduce IHD mortality rates have to include better primary prevention as well as more timely access to medical care. At the same time, improving the quality of care is also required through long-term monitoring and an adequate registry system.22)
In the present study, crude mortality rates from cardiovascular diseases were higher in men than those in women during the earlier years. But the consistently higher rates of cardiovascular mortality amongst men saw a change from the early 1990s, with the mortality rates for women climbing above rates for men. This change is probably due to the phenomenon that life expectancy is increasing faster in Korean women than in Korean men.23) The male-to-female ratio in age-adjusted mortalities did not significantly change. When the age distribution was standardized, overall cardiovascular mortalities were always higher in men than in women. More specifically, age-adjusted IHD mortalities have been consistently two times higher in men than in women, and this difference between the sexes is consistent with previous observations.24,25,26) Among Korean patients with ST-segment elevation myocardial infarction,27) women had a higher risk of fatality than men. But the study suggested that the sex difference in the fatality rate was due mostly to age and clinical history, not gender itself.
The major strength of the present study is that it analyzed nationwide mortality data for the Korean population over a 30-year period. However, there are also several limitations to be discussed. First, the validity of cause of death can be debated. Statistics Korea annually reports the Cause of Death Statistics,4) and the database is primarily based on death certificates. However, causes of death in the database are subject to misclassification. A previous study retrospectively compared the Cause of Death Statistics4) with hospital medical records, and reported the overall accuracy of causes of death as 91.9%.28) Second, there are still a significant number of deaths recorded without underlying causes in the Cause of Death Statistics database. In 2012, an overall 9.4% of deaths were classified as unknown causes, although deaths of unknown cause are decreasing. Thus, there is a possibility that mortality from cardiovascular disease has been underestimated. Third, the reported number of cardiovascular deaths can be influenced by the health care system. Over the last few decades, Korea has experienced a marked improvement in medical service accessibility and health care technologies. These changes may have affected the reported number of cardiovascular diseases. Lastly, there is no available nationwide data on the incidence of cardiovascular diseases, so we cannot explore the substantial causes of changing mortality trends.
Conclusion
Even though total cardiovascular disease mortality rates have significantly decreased during the 30-year period of study, the IHD mortality rate continuously increased until recently. Prevention and management of cardiovascular diseases amongst the Korean population, especially for IHD, still remains a great challenge. In order to meet this challenge, continuous monitoring of the mortality trends for cardiovascular diseases is required.

 XML Download