

 PDF
PDF ePub
ePub Citation
 Print
Print


Introduction
Minimizing myocardial infarct size and preserving the left ventricle are a major determinant of clinical outcomes in patients with ST-segment elevation myocardial infarction (STEMI).1)2) Primary percutaneous coronary intervention (PCI) is widely accepted as the most effective reperfusion modality for STEMI, and invasive evaluation of the indices of microvascular function measured after PCI are useful predictors of any left ventricular functional changes, remodeling, and clinical outcomes.3)4)5)6)7)8)9) Therefore, measuring the microvascular function of infarct-related myocardial territory at the catheterization laboratory may allow for early identification of patients with high risk and determine the treatment strategy and monitoring. Several indices such as the index of microvascular resistance (IMR),3)4)5) hyperemic microvascular resistance index (hMVRI), coronary flow reserve (CFR),5)6)7)8) coronary wedge pressure,8)9) and phasic coronary flow patterns8)10) have been studied for evaluating microvascular integrity in patients with STEMI. Previous studies have shown that the IMR and hMVRI measured during optimal hyperemia are not affected by coronary hemodynamic statuses such as heart rate, preload, and afterload.5)8)
Thus, these indices have good reproducibility compared to CFR or another indice.11) However, the effect of hMVRI on long-term clinical outcomes in patients with STEMI has not been evaluated.
We evaluated the usefulness of hMVRI measured immediately after primary PCI in patients with STEMI during a long-term follow-up.
Subjects and Methods
Study population
We retrospectively enrolled 145 patients who underwent primary PCI within 24 hours after onset of symptoms, and hMVRI was evaluated immediately after revascularization between January 1999 and March 2008. The diagnosis of STEMI was based on characteristic chest pain >30 minutes duration, significant ST segment elevation (>1 mm at limb lead and >2 mm at precordial lead) in ≥ two contiguous electrocardiography leads, and an elevation of the myocardial band of creatine phosphokinase ≥ three times the upper normal limit. Exclusion criteria were previous myocardial infarction, the presence of cardiogenic shock, a history of PCI or coronary artery bypass graft, left main coronary artery disease, the presence of moderate to severe valvular lesions, and any significant arrhythmia or refractory ventricular arrhythmia rendering an intracoronary Doppler study inappropriate. In addition, patients with post-procedural thrombolysis in myocardial infaction (TIMI) <2 were excluded from the study. The study protocol was approved by the Ajou University Hospital Institutional Review Board.
Coronary angiographic procedure
At admission, patients were pretreated with chewable aspirin (300 mg) and clopidogrel (600 mg) as a loading dose or ticlopidine (500 mg) before coronary angiography. All patients received a bolus injection of 5000 IU heparin before angiography, and intravenous infusion of heparin was started (1000 U/hr). Additional heparin was administered to maintain an active clotting time >300 seconds during the procedure. We used the femoral artery approach with a 7 or 8 French guiding catheter for all patients. A stent was implanted following appropriate predilation by balloon catheter. All patients were advised to maintain lifelong aspirin (100 mg/day). Ticlopidine (500 mg/day) or clopidogrel (75 mg/day) was administered for at least 1 month in patients that received bare metal stents or for 1 year in patients that received drug-eluting stents. The quantitative coronary angiographic analysis was performed using the cardiovascular angiography analysis system II (CAAS II, pie Medical, Maastricht, Netherlands). After successful primary PCI, a contrast flow through the infarct-related artery was graded on the standard TIMI flow scale of 0 to 3 from the final coronary angiogram. Use of a thrombectomy device or distal protection device before PCI and the use of glycoprotein IIb/IIIa receptor inhibitor were determined according to the physician's discretion.
Microvascular functional assessment
After primary PCI, 100-300 ug nitroglycerin was administered into the coronary artery, and a 0.014-inch Doppler Flowire (12 MHz, FloWire™, Cardiometrics, Mountain View, CA, USA) was advanced through the guiding catheter. The tip of the wire was placed precisely just distal to the site of the culprit lesion to assess the microvascular function of the entire region at risk. A bolus of 48-60 ug adenosine was used for the left coronary artery and 24-36 ug for the right coronary artery, followed by a 5-10 mL saline flush to induce optimal hyperemia. The CFR was defined as the ratio of the hyperemic averaged peak velocity (hAPV, cm/sec) to baseline averaged peak velocity (bAPV, cm/sec). hMVRI was calculated from the mean aortic pressure at the catheter tip divided by hAPV12) immediately after successful PCI.
Assessment of left ventricular function by echocardiography at admission and follow-up
Evaluation of the left ventricular function was performed with a commercially available echocardiography. The ejection fraction (EF) was measured on apical 4-and 2-chamber views by Simpson's method. The left ventricle was divided into 16 segments according to the recommendation of the American Society of Echocardiography.13) The global wall motion score index (WMSI) was analyzed and calculated using both endocardial motion and wall thickening and was quantified using a 5-grade scoring system as follows: 1=normal; 2=hypokinesia; 3=akinesia; 4=dyskinesia; and 5=aneurismal changes. The echocardiographic evaluation was performed by a cardiologist who was unaware of the results of the physiologic study.
Clinical follow-up
All patients were evaluated at the outpatient clinic and by telephone interviews. The primary endpoint of the study was major adverse cardiac events (MACEs) defined as a composite of cardiac death and re-hospitalization for congestive heart failure (CHF). CHF was defined by the simultaneous presence of at least 2 major criteria or 1 major criteria and 2 minor criteria as reported by the Framingham Heart Study.14)
Statistical analysis
The continuous variables were expressed as mean±standard deviation, and the discrete variables were expressed as counts and percentages. The Student's t-test was used for the continuous variables, and the chi-square test and the Fisher exact t-test were used for the categorical variables. Pearson's and Spearman's correlation coefficients were calculated as appropriate. The Cox regression analysis was performed to analyze the independent impact of MACE at a long-term period. All variables with p<0.2 in univariate analysis were entered into a multivariate analysis. The results were presented as a hazard ratio with 95% confidence intervals (CI) and p value. Survival curves with cumulative events were prepared according to the Kaplan-Meier method and compared using the log-rank test. A p<0.05 was considered significant.
Results
Baseline clinical, angiographic, and procedural results
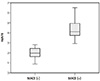
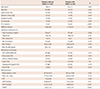
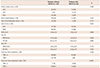
Between January 1999 to March 2008, a total of 145 patients were retrospectively enrolled. Table 1 and 2 summarize the clinical, angiographic, and procedural characteristics of patients with and without MACEs. Patients with MACEs were less likely to be male (88% vs. 72%, p=0.035), had lower EF (43±10 vs. 51±9, p<0.001) and higher WMSI (1.71±0.35 vs. 1.49±0.28, p=0.001) at baseline, a decreased CFR (1.51±0.57 vs. 1.93±0.69, p=0.006) and an increased hMVRI (4.37±1.54 vs. 2.65±1.12, p<0.001) compared to the patients without MACEs (Fig. 1). In addition, patients with MACEs achieved less often a post-procedural TIMI 3 flow.
Clinical outcome and impact of hMVRI on cardiovascular events
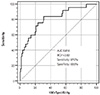
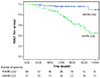
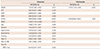
The mean follow-up duration was 85±43 months. Total MACEs occurred in 25 (17.2%) patients. Cardiac death occurred in 11 patients, and CHF requiring hospital admission occurred in 14 patients. The results of a receiver operating characteristic curve analysis for the prediction of MACE are shown in Fig. 2. The best cut-off value for hMVRI to predict MACEs during long-term follow-up was 2.82 mm Hg·cm-1·sec (area under the curve: 0.818, p=0.006), thus providing a sensitivity of 87% and specificity of 69%. A Cox proportional hazard analysis identified hMVRI (hazard ratio: 1.741; 95% confidence interval: 1.348-2.264, p<0.001) and EF (hazard ratio: 0.910; 95% confidence interval: 0.862-0.961, p=0.001) as independent risk factors for any future cardiovascular events (Table 3). The Kaplan-Meier analysis showed significantly worse event-free survival in patients with an hMVRI >2.82 mm Hg·cm-1·sec as compared with an hMVRI ≤2.82 mm Hg·cm-1·sec (Fig. 3).
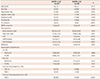
As a subgroup analysis, patients were divided in to two groups: patients with hMVRI ≤2.82 mm Hg·cm-1·sec (n=87) and patients with hMVRI >2.82 mm Hg·cm-1·sec (n=58). Clinical, angiographic, and procedural characteristics are listed in Table 4. Patients with hMVRI >2.82 mm Hg·cm-1·sec were more likely to have a history of hypertension as well as lower EF (46±8 vs. 52±10, p<0.001) and higher WMSI (1.64±0.29 vs. 1.45±0.29, p<0.001) at baseline, a decreased CFR (1.57±0.62. 2.04±0.67, p<0.001) compared with the patients with hMVRI ≤2.82 mm Hg·cm-1·sec. A final TIMI grade 3 flow was less frequently achieved in patients with hMVRI >2.82 mm Hg·cm-1·sec (Table 4). Multivariable analysis showed that the independent determinants for hMVRI >2.82 mm Hg·cm-1·sec were CFR {odds ratio (OR) 0.475, 95% CI 0.239-0.945; p=0.034}, EF (OR 0.939, 95% CI 0.892-0.990, p=0.019), and final TIMI flow 3 (OR 0.035, 95% CI 0.004-0.290, p=0.002) (Table 5).
Discussion
This present study showed that for patients with STEMI, favorable long-term outcomes occurred in patients with lower hMVRI as compared with in patients with higher hMVRI, and the microvascular indices were measured by an intracoronary Doppler wire immediately after primary PCI. The MACEs were significantly more frequent in patients with high hMVRI for long-term follow-up. The present study herein demonstrated for the first time that the hMVRI was an independent predictor of total MACE at a long-term period. Therefore, early measurement of microvascular function after primary PCI may be helpful in determining the early therapeutic strategy and monitoring. A microvascular dysfunction in the territory of a revascularized artery was related with the inability of a previously ischemic region to be reperfused, and a microvascular integrity was associated with any left ventricular functional changes and clinical outcomes in patients with acute myocardial infarction (AMI).15)16) Thus, identifying the status of microvascular integrity in individual patients was crucial for establishing a treatment strategy. The microvascular indices measured by a intracoronary Doppler guidewire or intracoronary pressure wire offered a better quantitative assessment of the microvascular status of the myocardium in patients with AMI compared to angiographic flow indices and had good correlations with the severity of myocardial damage, changes in the left ventricular function, or clinical outcomes of AMI.4)5)6)7)8) However, the microvascular integrity indices measured immediately after reperfusion might be favorably or adversely affected by many confounding factors. First, the microvascular functional status did not recover completely in the early stages of AMI. Second, these indices may be affected by many hemodynamic factors such as the baseline coronary blood flow, heart rate, and collateral functions independent of any microvascular and myocardial damage. Third, it was not uncommon that distal thromboembolization to microvasculature, epicardial and microvascular spasm, and cellular edema could affect the microvascular integrity at the early stage of AMI. Therefore, the microvascular function and coronary flow in the infarct territory may be altered with time, particularly in the early stage of AMI after primary PCI. Therefore, an accurate evaluation of infarct size and severity by microvascular integrity indices was difficult in the early stages of STEMI, particularly immediately after reperfusion therapy. Previous studies have suggested that CFR measured by intracoronary Doppler wire was correlated with changes in the left ventricular function and the clinical outcome.7)
However, the coefficient of variation of CFR may be up to 20%11)17) because CFR was largely affected by the baseline coronary flow velocity associated with heart rate, preload, contractility, and after PCI18) whereas the hyperemic coronary flow velocity was not affected by these hemodynamic conditions. An IMR suggested recently by Fearon et al.3) was associated with much lower variability and was not significantly affected by changes in the hemodynamic conditions in contrast to CFR because the hyperemic coronary flow velocity-used variables of this index were not related to the heart rate and preload as compared to CFR. A recent study demonstrated that hMVRI estimated using a novel dual-sensor (pressure and Doppler velocity) guidewire immediately after primary PCI was correlated with infarct size as defined by cardiac magnetic resonance, and increased microvascular resistance index was related to higher transmural extent of the infarction grade; also, this index was more accurate than CFR for predicting transmural MI.19) However, research about the association between hMVRI and clinical outcomes and the usefulness of hMVRI for predicting clinical outcomes in patients with STEMI has not been studied. In the present study, hMVRI measured by Doppler wire immediately after primary PCI in patients with STEMI was higher in patients with cardiovascular events compared to that of patients without cardiovascular events. The current results provide a possible explanation for the strong association between the microvascular dysfunction and any future development of cardiac death and CHF during long-term follow-ups. Our results suggest that for increased hMVRI measured immediately after PCI in patients with STEMI, long-term aggressive medical management was warranted to prevent MACE during the long-term follow-up.
Our study had several limitations. First, it was a retrospective, single center, long-term study. Therefore, different treatment regimens and strategies for STEMI in early-stage and late-stage patients such as medications and kinds of stents and different follow-up durations occurred. Thus, some bias cannot be excluded for the effect of these confounding factors on the clinical outcomes independent of the microvascular integrity. However, we found that the hMVRI remained a strong independent predictor of cardiovascular events for up to 12 years. Second, we measured hMVRI as a ratio of mean aortic pressure at the coronary catheter tip and distal hAPV. However, we measured hMVRI after successfully removing epicardial stenosis by successful PCI. If there had been any significant stenosis in the epicardial stenosis, hMVRI may be related primarily to epicardial stenosis. Because a minimum of residual stenosis due to successful PCI occurred, the effect of minimal epicardial stenosis as a predictor of hMVRI was effectively excluded.20)21) Third, we evaluated the microvascular function in patients with stable vital signs during primary PCI and in only patients that achieved TIMI grade ≥2 after PCI. Thus, the importance of post-PCI TIMI score as a predictor of future cardiac events decreased compared to that in previous studies.2)
In conclusion, hMVRI was a strong predictor of the development of long-term MACEs in patients with STEMI treated with primary PCI.

 XML Download