

 PDF
PDF ePub
ePub Citation
 Print
Print


Introduction
High sodium intake is a huge problem throughout the world. High sodium intake is a significant contributing factor that causes blood pressure (BP) elevation, along with increased risk of cardiovascular disease.1)2)3) World Health Organization recommends an overall reduction in sodium intake to less than 2000 mg/day of sodium.4) However, there have recently been some controversies about whether sodium intake reduction to the recommended level would be detrimental rather than helpful.5)6)7) Studies reporting that low sodium intake is associated with high cardiovascular morbidity and mortality have limitations. The current article will review and discuss two recent issues: 1) sodium intake and cardiovascular disease and 2) measurement methods used in the research on sodium intake.
Sodium Intake and Cardiovascular Events
High sodium intake and hypertension
The association between high sodium intake and hypertension has been well documented. The international co-operative study on the relation of BP to electrolyte excretion in population (INTERSALT) study evaluated this association, and it was the first large, multinational analysis of sodium intake, BP, and other comorbidities. The INTERSALT study estimated the average daily sodium intake by measuring the 24-hour urinary sodium excretion along with BP of participants from 52 communities.3) Through this collaborative effort, the researchers found a significant association between urinary sodium excretion and systolic BP in individual participants as well as in the pooled analysis. Furthermore, the association between the median 24-hour urinary sodium excretion and the adjusted slope of systolic BP with age in 52 centers was linear and significant. The linear association was persistent after the exclusion of 4 isolated populations who had extremely low urinary sodium excretion.8) Supporting the INTERSALT study, the European Prospective Investigation into Cancer in Norfolk study also found an association of urinary sodium excretion with BP difference.9) Along with these large-scale epidemiologic studies, many intervention trials have shown that BP is indeed lowered by decreasing the sodium intake.
In a randomized, double-blind, placebo-controlled trial, MacGregor et al.10) demonstrated that a reduction in dietary sodium intake from 162±9 mmol/day to 86±9 mmol/day can lower systolic BP by approximately 7.1 mm Hg. In another controlled trial, the Dietary Approaches to Stop Hypertension (DASH)-Sodium trial, the authors compared three levels of sodium intake; 50, 100, and 150 mmol/day for 30 days.11) The DASH diet with 50 mmol/day sodium level lowered the mean systolic BP by 7.1 mm Hg than the control diet with 150 mmol/day sodium level in participants without hypertension, and by 11.5 mm Hg in participants with hypertension. Population-based intervention of sodium intake reduction performed in Finland reduced the incidence of stroke by 75% and coronary artery disease mortality by 80%.12)
Similarly, numerous other meta-analyses have shown a positive effect of sodium intake reduction on lowering of BP.13)14) One meta-analysis published in the BMJ by He et al.,14) demonstrated that a mean decrease in urinary sodium excretion by 75 mmol/day was accompanied by a mean decrease in systolic BP by 4.18 mm Hg and a mean decrease in diastolic BP by 2.06 mm Hg.14) In the trials of hypertension prevention phase I (TOHP I) and phase II (TOHP II), the participants were randomly assigned to reduce sodium intake for 18 months (TOHP I) or 36-48 months (TOHP II).15)16) Compared to the control group, the intervention group reduced their sodium intake by 44 mmol/day (TOHP I) and 33 mmol/day (TOHP II), respectively. Although the decrease in BP was small (1.7/0.9 mm Hg in TOHP I and 1.2/0.7 mm Hg in TOHP II), after 10 to 15 years of completion of the original trial, the participants in the intervention group had an approximately 25% lower incidence of cardiovascular events after adjustment for confounders (relative risk: 0.75, 95% confidence interval: 0.57-0.99, p=0.04).17)
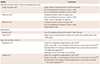
High sodium intake and cardiovascular disease (Table 1)
On the contrary, a meta-analysis (that was withdrawn) had reported that salt intake reduction has no clear benefit in reducing the mortality or cardiovascular morbidity.18)19) In addition, an analysis of cohort data showed that the highest cardiovascular mortality was found in subjects who had the lowest 24-hour urinary sodium excretion at baseline.5) In this study, the authors found a paradoxical correlation such that people with the highest sodium intake had the lowest cardiovascular mortality despite the positive association between high BP and increase in sodium intake. The Ongoing Telmisartan Alone and in Combination with Ramipril Global Endpoint Trial (ONTARGET) study as well as the Telmisartan Randomized Assessment Study in ACE Intolerant Subjects with Cardiovascular Disease (TRANSCEND) and the Prospective Urban Rural Epidemiology (PURE) study showed a J-shaped association between estimated urinary sodium excretion and cardiovascular events.6)7) According to the results of these studies, the recommendation for sodium intake of less than 2000 mg/day may be harmful because it has the possibility of increasing cardiovascular morbidity and mortality.
This result and the controversy surrounding it has created a strong demand for additional, large, prospective, long-term, randomized controlled trials in order to demonstrate the beneficial effect of sodium intake reduction and to further elucidate the counterintuitive finding that reducing sodium intake is harmful.20) However, such studies are difficult to perform due to many factors such as difficulty in determining the complexity of food and the exact proportion of sodium actually consumed by an individual on a daily basis. Furthermore, it is very difficult to accurately and consistently have the study participants restrict food intake according to a specific regimen for many years' duration. Furthermore, the analysis of the ONTARGET and TRANSCEND trial data,6) along with data from the PURE study7) indicated some flaws that were in common with other similar studies. Moreover, these studies had methodological flaws that will be discussed further in the next section.
In another meta-analysis by He et al.21) the authors obtained a different result compared to that obtained by Taylor and colleagues.18) Taylor and colleagues had excluded the Trial of Nonpharmacologic Interventions in the Elderly (TONE)22) and had included the study by Paterna et al.23) He and MacGregor21) had included the TONE study and had excluded the study by Paterna et al.23) since the study by Paterna et al.23) specifically evaluated the effect of sodium intake reduction in patients with heart failure. Different methods for performing the meta-analyses yielded completely different results among these studies. The meta-analysis by He et al.21) had decreased bias in the analysis because the participants of the heart failure trial were in a state of severe sodium and water depletion due to aggressive diuretic therapy and fluid restriction. The flaw in the study by Paterna et al.23) was that they did not adjust the dose of diuretics along with the implementation of a more aggressive sodium restriction, which resulted in overtreatment with worse outcomes in individuals in the sodium reduction group.
In the combined cohort analysis by Stolarz-Skrzypek et al.5) there is a lack of discussion or insight into potential confounders that may have led to the finding that higher sodium intake levels lead to a lower cardiovascular mortality. First, the time of recruitment of each cohort is different which may confound the data. In the Flemish Study on Environment, Genes, and Health Outcomes (FLEMENGHO), the participants were recruited from 1985 to 1990, and from June of 1996 to January of 2004, additional families were recruited. The recruitment of participants in the European Project on Genes in Hypertension (EPOGH) started in 1999 and ended in 2001. One thought is that since the recruitment was performed at such varied time periods, the advances in medicine and treatment that could have caused Stolarz and colleagues5) to observe a false decrease in morbidity and mortality in the high sodium intake group. The changes in treatment include the introduction of statins and antiplatelet agents to the therapeutic regimen in patients with known cardiovascular or coronary disease. The fact that the authors did not report the follow-up duration for each cohort in the outcome analysis, the longer follow-up duration of FLEMENGHO may be reflected in the higher rate of cardiovascular events compared to that in EPOGH (7.89% vs. 2.38%, repectively). Secondly, the outcome analysis was solely based on the baseline level of 24-hour sodium excretion, and not on the change in the 24-hour sodium excretion throughout the study period. Furthermore, they did not provide any information about the intervention and how the participants decreased their sodium intake, which was included in the analysis or discussion. They did not discuss the methods used to control the sodium intake whether or not the participants inadvertently increased their sodium intake during the follow-up period although they were supposed to be on a low sodium diet at baseline. They could not exclude the possibility that some of the cardiovascular events were related to an increase in sodium intake during the study period. Third, they did not evaluate the reason why participants had a low sodium intake at baseline and they failed to mention the nutritional status since poor nutritional balance often has a detrimental effect on health. The recommended sodium intake is calculated on the basis of adequate daily intake of nutrients in a balanced state. Thus, low sodium intake during a poor nutritional balance state (i.e., starvation) is quite a different matter. In such a person, it is easy to expect a poor cardiovascular outcome.
The analysis of the ONTARGET and TRANSCEND trial data,6) along with that of the data from the PURE study7) also showed some of the same flaws as in the study by Stolarz-Skrzypek et al.5) In addition, their study had methodological flaws that will be discussed in the following section.
Lastly, the BP response observed in relation to dietary sodium intake is not homogeneous within the population, and it has been shown that sodium-sensitive individuals demonstrate a greater change in BP with alteration in their sodium intake. Sodium sensitivity has been found to be an independent predictor of cardiovascular events.24)25) Subjects with hypertension and sodium sensitivity had the lowest cumulative survival rate. The association between sodium sensitivity and mortality was independent of elevated BP.25) Although the exact prevalence of sodium sensitivity is unknown, it is expected that more than 50% of hypertensive subjects have sodium sensitivity.26)27) Different BP responses to the same amount of sodium intake may be an explanation for the inconsistent result regarding the association between high sodium intake and cardiovascular events. However, it does not always mean that individuals with sodium resistance are free from complications associated with high sodium intake. It has been shown that morning BP surge is an independent risk factor for cardiovascular events.28)29) Individuals with sodium resistance showed an elevation of morning BP after high sodium intake.30)
Low sodium intake and high renin level
High renin activity is associated with high cardiovascular morbidity and mortality.31)32)33) Accordingly, it has been known that a reduction in sodium intake can elevate plasma renin activity.34) In a meta-analysis by Graudal et al.13) restriction of sodium intake was found to be associated with activation of the renin-angiotensin-aldosterone system. Thus, it has been postulated that activation of the renin-angiotensin-aldosterone system due to reduction of sodium intake may be the reason for the higher incidence of morbidity and mortality.35)36)37) However, the elevation of plasma renin activity by reducing sodium intake is only apparent in short-term interventional studies which are mostly less than 3 months.38) There is currently no long-term study of more than 3 months showing persistent elevation of plasma renin activity after reduction in sodium intake. Additionally, we found no association between sodium intake and plasma renin activity within the general population in a cross-sectional study.39) There is a possibility that plasma renin activity might return to normal when sodium intake is restricted over a longer period of time; however, there is still no study that confirms whether or not there is such an effect.
Measurement Methods of Sodium Intake
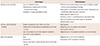
Accurate estimation of an individual's or a population's average sodium intake is essential to study the association between sodium intake and health and to establish a proper sodium intake reduction policy. Dietary surveys and urine collection methods are commonly used for the estimation of sodium intake. Prior to any study that use the assessment of sodium intake, the researchers should know the advantages and disadvantages of each method in detail (Table 2).
Dietary survey methods
Dietary survey methods are widely used because of the convenience and easy applicability to the population. The method requires the use of questionnaires or interviews to obtain specific information on food intake, which can then be converted into nutrient intake by using the food composition table. These surveys include dietary record, 24-hour dietary recall, food frequency, brief dietary assessment instruments, and diet history which can be used alone, in combination, or with modifications that are tailored for specific studies. The disadvantages of dietary survey methods are inaccurate estimation of dietary intake because of the inherent limitations such as reporting errors, inaccurate or incomplete food composition tables, missing data, and coding errors.40)41)42)
The actual amount of sodium intake can be affected by the variable proportion of sodium added during cooking or eating and the variable content of sodium in manufactured or processed foods.43)44) In addition, sodium loss during cooking (due to washing) or eating (sodium in the soup left behind in the dishes or bowel) should be considered, but it is extremely difficult to incorporate this sodium loss into any type of survey method.
There is also often a discrepancy between the sodium intake measured by dietary survey methods and 24-hour urinary collection method, and in one study, patients showed a tendency to underestimate their sodium intake by 30 to 50%.45) The analysis of data from the TONE study also revealed a larger under-estimation of sodium intake by 24-hour dietary recall than by 24-hour urine collection.40) Furthermore, the correlation between the dietary survey method and the 24-hour urine collection method in the estimation of sodium intake was not good (r=0.3) although it was statistically significant.40)46)
Another disadvantage of the dietary survey method is that a direct comparison of sodium intake between countries is difficult because they use different food composition tables. Analysis of data from the international collaborative study of macronutrients, micronutrients and BP (INTERMAP) study clarified the difference between sodium intake measured by a 24-hour dietary recall and that measured by two 24-hour urine collections.47) The differences between countries were not consistent and ranged from 0.3% to 30%, indicating a significant estimation error by the dietary recall method. The validity of food composition tables is inconsistent and also considered to be an important source of errors.42)48) There are no validation tests or standards for food composition tables, and due to the cultural and linguistic differences it would be nearly impossible to create uniform food composition tables throughout the world. The most recent Korean National Health and Nutrition Examination Survey has modified the food composition table by implementing recalculation of sodium intake, which differs from that in previous surveys. Use of the modified food composition table will yield a different result of sodium intake from that in a previous survey.
The 24-hour urine collection method
Approximately 85 to 90% of ingested sodium is excreted in urine,49) while the rest is lost either in feces or sweat due to exercise and high-temperature climates.50) Unlike the dietary survey method, the urine collection method is not influenced by interviewers, different cooking methods, eating habits, and diverse survey methods. Furthermore, it enables the comparison of data between countries, or between old and new data. Thus, the urine collection method is more reasonable and likely to be more accurate in comparing sodium intake between populations and studies, allowing for a greater ability to design collaborative multi-national studies or large-scale meta-analyses.
However, the major disadvantage of the 24-hour urine collection method is that it requires a high level of participant compliance as well as education on the complete collection method. Thus, performing measurements in more than 1000 people in a limited time period may be exceedingly difficult. Since there is a large day-to-day variation in sodium intake, a single collection of 24-hour urine may not be enough for estimation of individual sodium intake. At least nine to fourteen 24-hour urine collection specimens have been recommended in order to obtain the highest yield and the most accurate results.51)52) However, when performing an epidemiologic study in a large population, obtaining multiple collections of 24-hour urine is difficult and frequently impractical. On the other hand, a single 24-hour urine collection from a large number of people may improve the accuracy of estimation of sodium intake in the population.53)
Another disadvantage is that urine collection should be performed in a manner that will prevent loss of urine, for example forgetting to void in the sample container. The INTERSALT study was entirely dependent on the participant's report on the determination of complete urine collection, in which the participant may forget to report loss of urine.3)54) Due to this limitation, biochemical methods such as urine creatinine and para-aminobenzoic acid (PABA) excretion have been used to determine complete urine collection. In a study by Bingham and Cummings55) the mean recovery of PABA over 24-hours in urine was 93±4% in 33 free living volunteers when it was given at a dose of 240 mg a day. The range in individual recovery from maximum to minimum was 15% of the mean. In other sodium intake surveys in the UK, PABA was used to determine complete collection of 24-hour urine, which will contain 85-110% of the PABA marker in order to be considered complete.56)57) However, PABA is unavailable in some countries and it elevates the cost of the survey. Another drawback of using PABA is that PABA has also been known to cause a hypersensitivity reaction in susceptible individuals, although the incidence is very low.58)
Instead of PABA, urinary creatinine excretion has been used as a marker for the determination of complete urine collection since it is easy to use and is not very expensive. However, urinary creatinine excretion is highly dependent on the amount of ingested protein59) and the individual's lean body mass.60) Various formulae for creatinine excretion have been used to check for adequate collection of 24-hour urine.61)62)63)64)65)66) Among them, the formula suggested by Knuimann et al.61) has the highest sensitivity and specificity.67) In our survey in 2011, we used urinary creatinine excretion in addition to the participant's report for the loss of urine.66) The percentage of valid urine collection based on our criteria was 74.2%, which seemed to be lower when compared to that in other studies. The percentage of valid urine collection depends on the criteria for the creatinine-based determination method used. When we applied the method used in a Finnish study,62) the percentage of valid urine collection in our study was 96.6%. When the Portuguese adult population study criteria was used, the percentage of valid urine collection was 93.5%.63) Irrespective of the creatinine-based methods used, there was no difference in the estimated sodium intake in the study population.66)
Regardless of the aforementioned limitations, the 24-hour urine collection method is becoming the "gold standard" method in the estimation of sodium intake.53) In our survey in 2011, among the 21 countries surveyed, 9 countries used the 24-hour urine collection method, 3 countries used a combination of the dietary survey and 24-hour urine collection method, 3 countries used the spot urine collection method, and 6 countries used only the dietary survey method.68) In another survey, less than half of the 30 surveyed countries used the 24-hour urine collection method.69)
Spot urine collection method (Table 1)
Because of the inconvenience and high participant burden of the 24-hour urine collection, a less demanding method has been sought after. As a potential solution, estimation of the 24-hour urinary sodium excretion by using the calculation from a randomly or timely collected spot urine sample has been suggested.70)71)72)73) These equations showed a fairly high correlation between the calculated 24-hour urinary sodium excretion and the measured 24-hour urinary sodium excretion.
Several studies have used the calculated 24-hour urinary sodium excretion from spot urine for evaluation of the relationship between sodium intake and cardiovascular disease or central aortic BP.6)74) Two recent studies evaluated the association of urinary sodium and potassium excretion with cardiovascular events and overall mortality.6)7) They calculated the 24-hour urinary sodium and potassium excretion from a morning fasting urine sample using the Kawasaki formula,70) and reported an interesting J-shaped association between the estimated urinary sodium excretion from the single morning fasting urine sample and cardiovascular events. They also reported the result of the validation analysis of the Kawasaki equation which they used for an accurate calculation.75) Although they suggested that the Kawasaki equation is the most valid and least biased method, the serious drawback of the spot urine method for estimation of the 24-hour urinary sodium excretion should be considered.
One potential drawback of the spot urine collection method is that its accuracy is dependent on the time of urine collection, since there is a large variation in urinary sodium excretion throughout the day. This large variation exists not only between individuals, but it is also observed to fluctuate throughout the day in a single person.76)77)78) In addition, this variation is also dependent on the amount of sodium ingested.79) Due to this variation, the time of spot urine collection may significantly influence the accuracy of the estimating equation and result in skewed or incorrect data. Although the Kawasaki equation was developed for the second morning urine,70) O'Donnell et al.6)7) used the first morning or fasting morning urine in the Kawasaki equation instead of the second morning urine. The Tanaka equation was developed for the randomly collected urine.71) Kawamura et al.80) suggested that second morning urine is better than randomly collected urine when using the Kawasaki equation. However, Mann and Gerber73) recommended collection of spot urine samples at the midpoint of 24-hour urine collection (for example in the late afternoon) for the highest correlation between the measured and estimated 24-hour urinary sodium excretion.
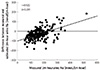
For validating any particular method, the correlation analysis is not enough for assessing the agreement between methods. A significant correlation between the measured and estimated 24-hour urinary sodium excretion does not always mean that both methods can be used as substitutes for each other. Similar to our study, the validation test of the Tanaka equation in an external population showed a significant difference between the estimated and measured 24-hour urinary sodium excretion (p<0.001).71) There was also a significant difference between the measured and estimated 24-hour urinary sodium excretion in the validation test among the PURE study population.75) Furthermore, when using the Bland-Altman method for comparison of the two methods, the limits of agreement and percentage errors should be considered. 81)82) Ji et al. as well as ourselves used the Bland-Altman method to determine the agreement between the spot urine collection method and the 24-hour urine collection method for the estimation of sodium intake.83)84)85) All equations showed large limits of agreement approximately more than 100 mmol.72)75)83)85) Furthermore, the equations used for calculation of the 24-hour urinary sodium excretion from spot urine have a tendency for under- or over-estimation of the 24-hour urinary sodium excretion according to the level of an individual's sodium intake (Fig. 1).85)
Despite the tendency of these calculations for under- or over-estimation of the 24-hour sodium excretion and their large limits of agreement, Mente et al.75) concluded that estimation of the 24-hour urinary sodium excretion from a single morning fasting urine specimen by using the Kawasaki equation is also suitable for large population studies, and they used the spot urine method in their study.7)
Due to the various drawbacks of the spot urine collection method and the equations used to estimate the 24-hour urinary sodium excretion, there is still no single calculation or method that is able to accurately estimate the 24-hour urinary sodium excretion among the individuals in a study.
Conclusion
Although the recent studies argued that the current recommendation for dietary sodium intake should be changed, the association between low sodium intake and high risk of cardiovascular events is not evident because of the various drawbacks of the methods. Until now, there is no doubt that high sodium intake elevates BP and it may eventually lead to high risk of cardiovascular events. Furthermore, using the accurate method and knowing its limitations in the measurement of sodium intake is an essential step towards proper understanding of hazardous effects of high sodium intake, which will promote sodium intake reduction in humans.
 XML Download