

 PDF
PDF ePub
ePub Citation
 Print
Print


Introduction
Left ventricular (LV) systolic function is an independent predictor of outcome after aortic valve replacement (AVR) in patients with severe aortic stenosis (AS).1)2) Previous studies have mostly shown that patients with a reduced ejection fraction (EF) and severe AS have higher operative mortality and poor survival benefit versus those with normal EF.3)4)5)6) However, patients with reduced EF represent <5% of the population of patients with AS,2)4) and most patients who underwent AVR have preserved LV systolic function. Although dobutamine stress echocardiography is used for risk stratification of patients with reduced EF and severe AS,7)8) it is unclear what the best method is in patients with preserved EF and severe AS.
Severe AS causes LV pressure overload and results in myocardial fibrosis and impairment of myocyte ultrastructure.9)10)11) Also, it has been shown that the amount of myocardial fibrosis and myocyte degeneration affect LV systolic and diastolic dysfunction.9)12)13) With the development of cardiac magnetic resonance imaging (CMR), it was seen that late gadolinium enhancement (LGE) showed a good correlation with the degree of myocardial fibrosis by histopathology.14)15) Moreover, the amount of myocardial fibrosis was found to be an independent predictor of clinical outcome after AVR, and it had a meaningful association with LV functional remodeling.14)15) A problem with this analysis, however, is that histopathological measurement of fibrosis before AVR is too invasive for predicting long-term outcomes of patients with severe AS. Also, CMR comes at a high medical cost and cannot be used in patients with an intracardiac device. The purpose of our study was to investigate the differences between LV geometric changes following AVR according to the presence of LGE on CMR and to evaluate echocardiographic predictors of LGE in patients with severe AS and preserved LV systolic function.
Subjects and Methods
Study population and protocol
We enrolled 41 patients who were scheduled for an AVR due to severe AS, but who had preserved LV systolic function (EF ≥50%) from January 2010 to April 2012. Severe AS was defined as having an aortic valve area ≤1.0 cm2 and having symptoms such as dyspnea on exertion or syncope.16)17) All patients were evaluated by CMR, transthoracic echocardiography (TTE), and coronary angiography (CAG) before undergoing AVR. The exclusion criteria were any of the following: 1) having reduced LV systolic function (EF <50%), 2) having luminal narrowing of more than 50% by CAG, 3) having valvular disease more than grade I except AS, 4) having had a previous cardiac surgery, 5) having a history of percutaneous coronary intervention, or 6) having a history of myocardial infarction.
This study progressed prospectively after the enrollment of patients. All enrolled patients were evaluated by TTE, CMR, and CAG within 1 month before AVR, and the post-AVR TTE was conducted within 2 weeks after AVR (Fig. 1). Eight patients with EF <50% were excluded. Finally, 41 enrolled patients received follow-up appointments at an outpatient clinic. Repeat post-AVR TTEs were performed 6 months and 12 months after AVR.
This study protocol was approved by the Institutional Review Board of the Yonsei University Health System. All patients provided written informed consent.
Standard echocardiographic measurements
Chamber size {left atrial volume index (LAVI), LA dimension, wall thickness of the LV, LV mass index (LVMI), and LV end diastolic dimension (LVEDD)/LV end systolic dimension (LVESD)}, flow pattern {trans mitral flow velocity (E wave, A wave), deceleration time}, and tissue Doppler imaging (TDI) of the mitral annular septal area {peak diastolic velocity (e'), peak systolic velocity (S')} were measured according to the American Society of Echocardiography (ASE) guidelines.18)19)20) Two-dimensional echocardiographic assessment of LV volume and LV EF was performed in apical two- and four-chamber images. The endocardial border at both the end-diastolic and end-systolic frame was traced manually, and LV end diastolic volume (LVEDV), LV end-systolic volume (LVESV), and LVEF were calculated using the single-plane Simpson formula. LV mass was calculated from LV linear dimensions, as recommended by of ASE. The posterior wall thickness (PWTd) and septal wall thickness were measured at end diastole. Relative wall thickness (RWT) was calculated with the formula (2×PWTd)/LVEDD. LAVI was also measured from the biplane method of disks (modified Simpson's method) using apical two and four chamber views at ventricular end systole (maximum LA size). All echocardiographic parameters were determined by a sonographer who was blinded to the patient's information. The results were confirmed by a second expert echocardiographer who was unaware of the patients' clinical information.
Magnetic resonance imaging protocol
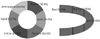
All patients underwent CMR within 1 month prior to AVR. CMR was performed on a 1.5 T cardiac magnetic resonance system (Achieva 1.5 T; Philips Medical Systems 5680 DA, the Netherlands). The myocardium of the LV was evaluated in the short axis view,21) and divided into base level (six segments), mid level (six segments) and apex (four segments). Consequently the entire myocardium of the LV was analyzed as a total of 16 segments (Fig. 2). The appropriate inversion time of LGE CMR image was determined by inversion scout (TI-scout) with the Look-Locker technique. The mean inversion time for normal myocardium was 250-300 ms. All CMR (cine and LGE images) images of the entire LV were acquired with a 10-mm slice without a gap. The volume of the LV was determined by planimetry from a series of short-axis acquisitions covering the LV completely from the apex to the base. Quantification of LVESV, LVEDV, and EF were performed on the short-axis series with manual contour segmentation of the endocardial borders. The total LV stroke volume was obtained by subtracting the LV end-systolic volume from the LV end-diastolic volume. Each image was acquired 10-15 minutes after injection of 0.2 mmol/kg body weight gadotertate dimeglumine (Dotarem; Guerbet, Roissy CdG Cedex, Paris, France) to measure LGE from CMR. Endocardial and epicardial borders were traced semi-automatically, and LGE was defined as the pixels above the pre-determined threshold using the Q-MASS software (QMASS MR 7.4, Medis Medical Imaging Systems bv, Leiden, the Netherlands).15)22) The pre-determined threshold was defined as mean signal intensity (SI) total myocardium+2 standard deviation (SD) of mean SI of a non-diseased area without LGE+2SD of mean SI of air (Fig. 2).15)
Statistical analyses
The normally distributed continuous variables are expressed as means±SD. We compared baseline characteristics and echocardiographic parameters between patients with and without LGE. Statistical significance (p<0.05) for comparisons was assessed using the unpaired two-tailed Student's t-test for normally distributed continuous variables and the χ2 test for nominal variables. All echocardiographic parameters were compared sequentially to the data from pre-AVR, post-AVR, 6-month follow-up, and 12-month follow-up analyses using a paired t-test and a mixed linear model according to the presence of LGE (significance defined as p<0.05).
Univariate and multivariate logistic regression analyses were used to confirm which echocardiographic parameters were associated with the presence of LGE (p<0.05). Variables selected for multivariate analysis were those with p<0.05 in the univariate analysis or were thought clinically to be associated with the presence of LGE. Variance inflation factors were used to measure co-linearity in multiple regression analyses.
Results
Baseline characteristics
In total, 49 patients were screened and eight with EF <50% were excluded before AVR. Finally 41 patients (24 males, 63.1±8.7 years) completed follow-up at 6 and 12 months post-AVR. LGE was detected in 12 (29.3%) patients. The main detection locations for LGE were the inferior wall (81.8%), the inferior septum (72.7%), and the mid-level (100%) of the LV (Fig. 3). Bicuspid AV was detected in 15 (36.6%) patients as the cause of AS.
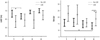
Table 1 shows baseline characteristics for the initially enrolled patients. Neither age nor gender was significantly different between the two groups. Also, history of diabetes mellitus, hypertension, and dyslipidemia were similar in both groups. Use of medications that could have an effect on LV geometry and filling pressure did not differ significantly after the operation. However, echocardiographic findings showed significant differences between the two groups. The thickness of the inter-ventricular septum (14.3±2.6 mm vs. 11.5±2.0 mm, p=0.001) and of the LV posterior wall (14.3±2.5 mm vs. 11.4±1.6 mm, p<0.001) were greater in LGE+ patients.
Tissue Doppler imaging offered the most important findings: LGE+ patients had lower e' (3.2±0.9 cm/s vs. 4.8±1.4 cm/s, p=0.002), S' (4.4±1.4 cm/s vs. 5.5±1.2 cm/s, p=0.021), and higher E/e' (21.8±10.3 vs. 15.4±6.3, p=0.066). However, the size of the cardiac chambers, the aortic valve area, and the pressure gradient via the aortic valve and LV systolic function were not significantly different (Table 1).
Left ventricular remodeling after aortic valve replacement according to the presence of late gadolinium enhancement
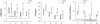
The sequentially measured post-AVR echocardiographic parameters were compared with those measured before AVR. LVEDD and RWT were decreased significantly after AVR in patients without LGE, but there was no significant decrease in patients with LGE. LVMI was decreased regardless of LGE (Fig. 4). E/e', an index of LV filling pressure, was improved significantly in LGE- patients up to 12 months (from 16.0±6.6 to 12.3±4.3, p=0.001) after AVR. Also, E/e' at 12 months showed a significant difference between LGE- and LGE+ (12.3±4.3 vs. 19.9±8.3, p=0.026) compared with those prior to AVR (15.4±6.3 vs. 21.8±10.3, p=0.066) (Fig. 5, Table 1). However, no improvement was observed of E/e' in LGE+ patients. Additionally, increases in the LV EF showed no significant change between the groups through the 12-month follow-up period (Fig. 5).
Multivariate logistic regression analysis on the presence of late gadolinium enhancement
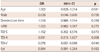
Tissue Doppler imaging e' (odds ratio=0.078, 95% confidence interval=0.007-0.888, p=0.040) was independently associated with LGE by CMR in patients with severe AS (Table 2).
Discussion
This prospective study showed that the presence of LGE for risk stratification before AVR in patients with severe AS could play an important role in predicting the long-term outcome and improvement of LV remodeling after AVR. CMR, a non-invasive method, makes it possible to predict myocardial fibrosis and LGE,14)15) and we found that the presence of LGE had effects on poor improvement of LV filling pressure in patients with severe AS. However, unlike previous studies,14)15) this study showed that some echocardiographic parameters were associated with the presence of LGE; these findings can be used clinically in patients with contraindications, as determined by CMR. TDI E', especially, is a clinically useful clue of risk stratification before AVR in patients with severe AS and preserved LV systolic function.
Myocardial fibrosis by biopsy and late gadolinium enhancement by cardiac magnetic resonance imaging
Previous studies reported that LGE in CMR reflected myocardial fibrosis, as determined by histopathology, in patients with severe aortic valve disease, including aortic regurgitation.15) Additionally, LGE in CMR has also been found to indicate necrosis by myocardial ischemia,23)24)25) variable changes by non-ischemic cardiomyopathy,26)27)28) and hypertrophic cardiomyopathy,29) as well as myocardial fibrosis. A recent report showed that LGE measurements from CMR were overestimated versus the amount of fibrosis estimated by pathology.22) Moreover myocardial fibrosis associated with severe AS did not show a diffuse pattern, but rather a patch-like appearance, and was usually located at the basal area of the LV.14) Based on these results, it can be concluded that cardiac biopsy to determine the presence of myocardial fibrosis before AVR will yield a high number of false negative results.
Late gadolinium enhancement by cardiac magnetic resonance imaging and left ventricular remodeling after aortic valve replacement
As mentioned previously, LV systolic function is an important predictor of operation mortality and clinical outcome. The risk stratification of patients with reduced EF and severe AS has been evaluated by various methods.7)8) However, although patients with preserved LV systolic function represent a large proportion of those with severe AS, evaluation for risk stratification prior to an operation is not enough. Furthermore, there has been no report showing a direct association between the presence of LGE and geometric remodeling of LV after AVR among patients with preserved LV systolic function.
The amount of myocardial fibrosis that was measured during the operation has an important association with long-term post-AVR outcome in patients with severe AS.14) With the availability of CMR, it is important to use LGE to determine risk stratification before AVR in patients with severe AS. This study showed that the presence of LGE was associated with poor improvement of LV geometry and filling pressure after AVR, especially in patients with preserved LV systolic function.
Clinical implications of echocardiography to predict late gadolinium enhancement and limitations of cardiac magnetic resonance imaging
Cardiac magnetic resonance still has important limitations, such as its high medical cost, contraindication in patients with an intracardiac device, poor availability, and limited use in patients with claustrophobia. Thus, we compared echocardiographic parameters with the presence of LGE as measured by CMR. As mentioned in the American College of Cardiology/American Heart Association/European Society of Cardiology guidelines,16)17) most patients with severe AS experience AVR during the period in which EF is preserved (≥50%). In this study, the aortic valve area, pressure gradient, and the size of cardiac chambers did not differ significantly according to the presence of LGE. LV wall thickness also did not appear to have important implications, based on the multivariate analysis. In the analysis of tissue Doppler imaging, TDI e' and S' showed significant differences between patients with LGE and those without LGE; TDI e' was independently associated with LGE after controlling related factors. Consequently, patients with severe AS and preserved LV systolic function also had reduced TDI e', which suggests a diastolic abnormality of the LV,18)20) and may be a surrogate marker of LGE in CMR.
Limitations
We analyzed the changes in LV geometry and the improvement of systolic function and filling pressure after AVR according to the presence of LGE in patients with severe AS and preserved LV systolic function. We did not, however, look for a difference according to the degree of LGE. Previous studies have classified 'mild' LGE according to the amount of LGE,14) but 'mild' LGE did not have any definite clinical implication in terms of risk stratification. Thus, further evaluations of the severity of LGE should be performed after the enrollment of additional patients. There was no mortality in our study after AVR during the 12 months of follow-up, so we could not analyze mortality outcomes according to the presence of LGE.


 XML Download