

 PDF
PDF ePub
ePub Citation
 Print
Print


Introduction
Contrast-induced nephropathy (CIN) has been recognized as a serious complication of percutaneous coronary intervention (PCI), and associated with increased short-term and long-term morbidity or mortality.1-4)
Although many risk factors associated with the development of CIN have been reported,5-7) decreased renal function and increased systemic exposure of contrast media (CM) are considered the most potent risk factors of CIN.8)9) Considering the importance of the prevention of CIN, it is important to determine the safe CM volume. Accordingly, previous investigators have suggested a safe CM dose regarding renal function.10-13) The key concept of those suggestions was reducing or adjusting CM dosage according to individual renal function. Therefore, the accurate estimation of renal function may be necessary to identify high-risk patients and to suggest a reliable pharmacotoxic model.
The most accurate method to estimate renal function is measured glomerular filtration rate (GFR) using radioisotope or radioiodine. However, the measure is both time- and cost-consuming and comes with potential side effects. Therefore, serum creatinine (sCr) itself or estimated GFR (eGFR) based on sCr are the most widely used methods in the clinical assessment of kidney function.14-16) Despite its validity, eGFR based on sCr has attracted criticism due to various confounding factors and its level of imprecision.
Recently, cystatin C (CyC) has received a lot of attention and appears to be a promising alternative to sCr for estimating GFR.17)18) Contrary to sCr, the CyC level depends almost entirely on the GFR and is less dependent on age, diet, nutritional status, and muscle mass.19-22) Moreover, it might be more useful to detect early stage renal dysfunction than sCr.23)
However, the efficacy of eGFR based on CyC (eGFRCyC) for the prediction of CIN was not fully evaluated and there was no previous study regarding safe CM volume estimation using eGFRCyC in patients with elective PCI.
Thus, we conducted this prospective study to assess the usefulness of the CM volume/eGFRCyC in predicting the risks of developing CIN and to determine the safe level of CM volume in patients undergoing PCI.
Subjects and Methods
Patients
This study was conducted in a single-institution setting of a tertiary university hospital from September of 2009 to August of 2011. The eligibility criteria of the present study were an age of 19 years or older and a referral for coronary angiography (CAG) and PCI. Exclusion criteria were as follows: cardiogenic shock, pulmonary edema, emergent PCI, end-stage renal disease requiring dialysis, and a previous administration of CM within 72 hours of PCI. This study was approved by the ethics committee of our hospital, and all participating patients provided written informed consent.
Study protocol
Renal function was assessed by a simultaneous determination of sCr and CyC. Baseline eGFR was calculated as creatinine clearance by a modification of diet in the renal disease (MDRD) study16) equation [eGFR=175×{sCr (mg/dL)}-1.154×{age (years)}-0.203]. A correction factor of 0.85 was used for women and the CyC based equation {eGFR=66.8×(CyC)-1.30} suggested by Rule et al.21) respectively. A two dimensional echocardiography was performed before PCI, and left ventricular ejection fraction (LVEF) was calculated by the biplane modified Simpson's method. All the patients were given the same hydration regimen with intravenous isotonic saline at a rate of 1 mL/kg/hr for 12 hours prior to and after PCI. Additional prophylactic medications for CIN (e.g., N-acetylcysteine) were not permitted to be administered to the patients. In diabetic patients, metformin was discontinued on the CAG day and withheld for the following 48 hours.
After informed consent was obtained, all procedures were performed at the operator's discretion. CAG and PCI were performed using the standard technique, via either a femoral or radial approach. All the patients received aspirin and clopidogrel. They were also administered glycoprotein IIb/IIIa receptor blockers and heparin at the discretion of the operator. In the current study, we used either iso-osmolar, non-ionic CM, or iodixanol (Visipaque™ 320 mg I/mL; GE Healthcare Korea, Seoul, Korea). The amounts of delivered CM were measured using an automated contrast delivery injection system (ACIST™; ACIST Medical Systems, Inc., Eden Prairie, MN, USA). CIN was defined as a 25% elevation or an absolute increase of >0.5 mg/dL (>44 umol/L) in the sCr level compared to the baseline within 48 to 72 hours after PCI, in accordance with the definition of the CIN consensus working panel.2)
Statistical analysis
All statistical analyses were performed with Statistical Package for the Social Sciences (SPSS) (release 15.0; SPSS Inc., Chicago, IL, USA). To identify the correlations between CIN and the clinical or laboratory parameters, a univariate analysis was performed using an unpaired t-test or Mann-Whitney U test for the continuous variables, and a chi-square test for the categorical variables, respectively. A multivariate logistic regression analysis was used to assess the correlation among the parameters, whose statistical significance was demonstrated on a univariate analysis at a level of p<0.05 and through previously well-known risk factors. Models were developed with stepwise techniques, for which the results were expressed as odds ratios (OR) with 95% confidence intervals (CI). Finally, the CM volume/eGFRCyC was added to the model as a separate predictor to test for any interaction between CM-volume and eGFR. An analysis of the receiver operating characteristic (ROC) was conducted to determine the cut-off value and area under the curve (AUC) of the CM volume/eGFRCyC and CM volume/MDRD for predicting CIN. We regarded a p<0.05 as statistically significant.
Results
Baseline characteristics of the study patients
A total of 1640 patients were referred for CAG and PCI, between September 2009 and August 2011. Of these, 723 patients were eligible for and enrolled into this study.
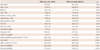
The study group was composed of 450 men and 273 women, with a mean age of 63.7±10.4 years old. Among all of the study patients, CIN occurred in 29 patients (4.0%). Patients were divided into two groups according the development of CIN: the CIN group (n=29) and the non-CIN group (n=694). Table 1 represents the baseline characteristics of patients of both groups.
Compared to the non-CIN group, clinical presentation as acute coronary syndromes was significantly more frequent in the CIN group. The CIN group showed significantly lower hemoglobin (Hb) and eGFR levels, and higher BUN, sCr, and CyC levels. They were also subjected to a higher CM volume, CM volume/eGFRCyC, and CM volume/MDRD.
Predictors of contrast-induced nephropathy
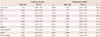
As shown in Table 2, reduced LVEF, Hb level, and eGFR using MDRD and CyC, increased CM volume, CM volume/MDRD and CM volume/eGFRCyC were found to be significantly correlated with the development of CIN in the univariate logistic regression analysis. Clinical presentations as acute coronary syndrome, age, and diabetes were not within the range of statistical significance. In the multivariate analysis, decreased Hb (OR 0.743, 95% CI 0.566-0.975, p=0.032) and increased CM volume/MDRD (OR 1.657, 95% CI 1.156-2.374, p=0.006) and CM volume/eGFRCyC (OR 2.275, 95% CI 1.496-3.461, p<0.001) remained as significant independent risk factors for the development of CIN.
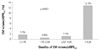
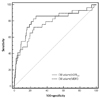
Furthermore, the significantly highest incidence of CIN was demonstrated in the 4th quartile of CM volume/eGFRCyC compared with the 1st, 2nd, and 3rd quartiles (p<0.001) (Fig. 1). The ROC curve was performed using CM volume/eGFRCyC to assess its ability to predict the development of CIN. It revealed a modest discrimination of CIN at a CM volume/eGFRCyC level of 4.493 (AUC=0.814; sensitivity=79.3%, specificity=80.0%) (Fig. 2). Although there was no statistically significant difference between CM volume/eGFRCyC and CM volume/MDRD, AUC of the CM volume/MDRD (0.772) was lower than those of CM volume/eGFRCyC. Of those patients (n=169) with CM volume/CyC eGFR ≥4.493, 13.6% (23/169) developed CIN, while those of CM volume/CyC eGFR <4.493 evinced a significantly lower incidence of CIN 1.1% (6/554; p<0.001).
Discussion
In this prospective and observational study, CM volume/eGFRCyC was identified as a significantly independent predictor of CIN compared with other previously well-known predictors. Therefore, we were able to estimate the safe CM volume via measuring eGFRCyC prior to CM administration. The CM volume/eGFRCyC can be considered a simple and reliable indicator for determining the safe volume of CM based on the pre-procedural CyC level. Although this simple model has a drawback in that many other variables are not included, this study also showed that other clinical and laboratory factors associated with CIN and CM volume/eGFRCyC remained independent predictors of CIN after an adjustment for these confounding factors.
Estimation of safe contrast volume per renal function
Many guidelines regarding the prevention of CIN recommend the minimal use of CM.24-26) However, it is not easy to determine the acceptable CM amount. In the PCI era, the use of CM is necessary to obtain satisfactory images and to perform PCI. Moreover, high-risk patients usually showed complex lesions and a proneness to the inevitable use of large amounts of CM. Among a number of CIN, CM volume can be changed and it can be potentially controlled at the discretion of the operator. Therefore, we need to guide individual quantities of safe CM volume prior to PCI.
Several studies have been trying to establish the risk of CIN after exposure to CM via a similar concept using the relationship between the CM exposure and baseline renal function. In 1989, Cigarroa et al.10) proposed a simple formula called maximal acceptable CM volume (CM volume/weight) based on the sCr level. In the retrospective study regarding high-risk patients (sCr >2.0 mg/dL or CM volume >300 mL), the cut off value of CM volume/eGFR (by Cockcroft-Gault equation) was defines as 6.0.10) Another study conducted in 3179 unselected patients undergoing PCI reported that CM volume/eGFR (by MDRD equation) of <3.27 might be a useful indicator in determining the CM volume which might be considered safe from the CIN.11) Previously, we also reported safe CM volume using grams of iodine per eGFR (g-I/eGFR) at a level of 1.42.27)
However, the abovementioned studies were based on sCr or eGFR using sCr. Although sCr has been the most widely used biomarker of renal function, it has serious limitations in terms of imprecision in reflecting renal function. It is frequently affected by a lot of non-GFR factors, including muscle mass, dietary habit, and age.15)16)28) Importantly, it has a limitation in detecting mild renal impairment.18)
Cystatin C is a non-glycosylated 13-kDa basic protein of the cystatin super-family of cysteine proteinase inhibitors.17) CyC shows a consistent production rate and is eliminated by glomerular filtration. It is less dependent on age, sex, race, and muscle mass.19) Therefore, CyC is considered to be a potential alternative to sCr for estimating GFR, and CM volume/eGFRCyC also suggested a better estimation of GFR that sCr based eGFR.
The CM volume/CyC eGFR represents both the amount of CM and individual renal function. It is obvious that an accurate measurement of renal function is required to make the model more reliable. From such a point of view, the method used in previous studies regarding safe CM volume estimation may have many limitations from the perspective of accuracy in GFR estimation.
In this study, using CyC, we demonstrated that CM volume/eGFRCyC could both represent individual renal function. In addition, both CM volume/MDRD and CM volume/eGFRCyC could be identified as independent predictors of CIN.
Another significant risk factor of contrast-induced nephropathy; Anemia
Apart from CM volume and renal function, another issue relating to CIN is anemia. Several studies also demonstrated a significant association of anemia and CIN. Thus, anemia could be deemed a risk factor for mortality in cardiovascular disease.6-8)29) Moreover, anemia is commonly combined with chronic kidney disease (CKD) and it can present as a complication of CKD. In this study, anemia was identified as an independent predictor of CIN after an adjustment for other risk factors. Yet, there remains limited data as to whether the correction of anemia can be helpful to prevent CIN, whereas, periprocedural blood loss was considered as a potent risk factor of CIN.30) Therefore, further data on anemia and baseline renal function prior to PCI is required to definitely determine their effects on the development of CIN.
Clinical Implications
In general, cardiovascular diseases often share many risk factors with renal disease. Therefore, a careful consideration of the safe CM volume would be mandatory for patients who are at an increased risk of developing CIN based on a decreased eGFR prior to the PCI. Moreover, PCI treatment for complex lesions is often prone to large doses of CM administration. In these high-risk patients, we should consider the measurement of CyC prior to PCI and pay attention to the safe CM volume, particularly based on the eGFRCyC, to prevent CIN when performing PCI.
Our present study consisted of controlled patients who were scheduled for elective PCI with appropriate hydration and had other nephrotoxic agents avoided. Contrary to emergency situations, in scheduled PCI, physicians can obtain sufficient information for a safe CM volume estimation prior to PCI. Therefore, results of the current study have more potent clinical implications than previous retrospective studies about unselected populations.
Limitations
There are some potential limitations to the current study. Although this study was a prospective controlled study, it cannot be considered free from its limitation as a single institution study. Therefore, caution should be exercised in generalizing the findings to more mixed populations. Furthermore, there remains debate regarding the differential safety of CM among various types of CM (isoosmolar CM and low-osmolar CM, ionic CM and non-ionic CM). Further studies with various types of CM are required to confirm the efficacy of this equation using eGFRCyC.
The most significant limitation is the reliability of CyC. Although the CyC based equation showed a better estimation of GFR compared with sCr, there was little validated data about eGFRCyC in Asian populations. Additionally, the incremental cost of improving GFR using CyC may also be considered. Future studies may provide an answer to this question.
Conclusions
Systemic exposure of CM was identified as an independent predictor of CIN after PCI. The delivered CM volume to eGFR calculated from both sCr and CyC, expressed as CM volume/MDRD and /eGFRCyC, both showed a predictive value for the occurrence of CIN. Based on the current results, we could suggest a safe acceptable CM volume of 4.493 mL (iodixanol 320 mg-I/mL) per 1 U of eGFR (mL/min/1.73 m2) and a pre-interventional determination of acceptable CM volume based on eGFRCyC, which might be helpful in avoiding CIN. In comparison of the predictive value of the sCr based and CyC based equation, there was no statistically significant difference between both methods.
 XML Download