

 PDF
PDF ePub
ePub Citation
 Print
Print


Introduction
The virtual histology-intravascular ultrasound (VH-IVUS) provides detailed qualitative and quantitative information, and it can identify four specific plaque components. Several studies have demonstrated larger amounts of necrotic core (NC) and more thin-cap fibroatheroma (TCFA) assessed by VH-IVUS in patients with acute coronary syndrome (ACS), compared with those with stable angina (SA).1-4)
However, no study has compared the plaque characteristics between non-culprit lesions (NCLs) in ACS patients (ACS-NCL) and target lesions (TLs) in SA patients (SA-TL). Therefore, the purpose of the present study was to attempt to compare gray-scale and VH-IVUS findings between ACS-NCL and SA-TL.
Subjects and Methods
Patient population
A total of 566 consecutive patients who had undergone gray-scale and VH-IVUS in NCL in ACS patients and in TL in SA patients between January, 2008 and September, 2011 were identified from the Chonnam National University Hospital VH-IVUS registry database. We compared VH-IVUS findings between 290 ACS-NCL and 276 SA-TL. The presence of SA was determined according to the Canadian Cardiovascular Society classification. Unstable angina and non-ST segment elevation myocardial infarction are considered to be closely related conditions whose pathogenesis and clinical presentations are similar, but of differing severity (i.e., they differ primarily in whether the ischemia is severe enough to cause sufficient myocardial damage to release detectable quantities of a marker of myocardial injury, most commonly troponin I, troponin T, or the MB isoenzyme of creatine phosphokinase). Once it has been established that no biochemical marker of myocardial necrosis has been released, the patient with an ACS may be considered to have experienced unstable angina, whereas the diagnosis of non-ST segment elevation myocardial infarction is established if a marker of myocardial injury has been released.5) ST-segment elevation myocardial infarction is a clinical syndrome defined by characteristic symptoms of myocardial ischemia, in association with persistent electrocardiographic ST-elevation and the subsequent release of biomarkers of myocardial necrosis. Diagnostic ST-elevation in the absence of left ventricular hypertrophy or left bundle-branch block is defined by the European Society of Cardiology/American College of Cardiology Foundation/American Heart Association/World Heart Federation Task Force for the Universal Definition of Myocardial Infarction as a new ST-elevation at the J point in at least 2 contiguous leads of ≥2 mm (0.2 mV) in men or ≥1.5 mm (0.15 mV) in women in leads V 2-3, and/or of ≥1 mm (0.1 mV) in other contiguous chest leads or the limb leads.6) We excluded patients with Thrombolysis in Myocardial Infarction (TIMI) 0-1 flow, coronary artery bypass graft lesion, chronic total occlusion, restenosis after stenting, important systemic disease such as systemic lupus erythematosus, amyloidosis, sarcoidosis, human immunodeficiency virus infection, and malignancies, and so on, or serum creatinine >2.5 mg/dL. NCL in ACS patients was defined as plaques viewed on an angiogram that had not been treated. TL in SA patients was defined as a coronary lesion whose diameter stenosis by quantitative coronary angiography (QCA) was greatest if the patient had multivessel disease. In the present study, we included all TLs, including both treated lesions and non-treated lesions, in SA patients. Plaques with more than a 30% diameter stenosis as compared with the reference diameter by IVUS were included in our study. Each plaque was separated by at least 5 mm from the edge of any other plaque or implanted stent edge. The protocol was approved by the institutional review board. Hospital records of all patients were reviewed to obtain clinical demographics and medical history.
Laboratory analysis
Peripheral blood samples were obtained before coronary angiography using direct venipuncture. The blood samples were centrifuged, and serum was removed and stored at -70℃ until the assay could be performed. The serum levels of total cholesterol, triglyceride, low-density lipoprotein cholesterol, and high-density lipoprotein cholesterol were measured using standard enzymatic methods. High-sensitivity C-reactive protein was analyzed turbidimetrically with sheep antibodies against the human C-reactive protein; this has been validated against the Dade-Behring method.7) Serum N-terminal pro-B-type natriuretic peptide was measured using an electrochemiluminescence sandwich immunoassay method with an Elecsys 2010 analyzer (Roche Diagnostics, Mannheim, Germany).
Coronary angiographic findings
Coronary angiogram was analyzed with validated a QCA system (Phillips H5000 or Allura DCI program, Philips Medical Systems, Eindhoven, the Netherlands). With the outer diameter of the contrast-filled catheter as the calibration standard, the reference diameter and minimal lumen diameter were measured in diastolic frames from orthogonal projections. Perfusion was evaluated according to TIMI criteria.8)
Intravascular ultrasound imaging and analysis
Gray-scale and VH-IVUS data were analyzed by 2 independent observers. The levels of reproducibility for external elastic membrane (EEM), lumen, and plaque plus media (P&M) cross-sectional areas (CSAs) using the Spearman rank-order correlation coefficients were 0.96, 0.97, and 0.97, respectively. Similarly, for plaque components by VH-IVUS, reproducibility for the fibrous (FT), fibro-fatty (FF), dense calcium (DC), and NC volume measurements using the Spearman rank-order correlation coefficients were 0.93, 0.94, 0.93, and 0.93, respectively.
Quantitative volumetric gray-scale and VH-IVUS analyses were performed across the entire lesion segment, and cross-sectional analyses were performed at the minimum lumen sites and at the largest NC sites. We analyzed the IVUS images and measured the diseased segment (normal to normal). Conventional quantitative volumetric gray-scale IVUS analysis was performed according to the American College of Cardiology Clinical Expert Consensus Document on Standards for the Acquisition, Measurement and Reporting of Intravascular Ultrasound Studies.9) Measurements were made at every 1-mm interval in the region of interest, which was defined as the segment between the most normal looking distal to proximal reference sites within 5 mm, proximally and distally, to the lesion. References were single slices with the largest lumen and smallest plaque CSAs within 10 mm proximally and distally. Hypoechoic plaque was less bright than the adventitia. Hyperechoic noncalcified plaque was as bright as or brighter than the adventitia without acoustic shadowing, and hyperechoic calcified plaque was brighter than the adventitia with acoustic shadowing. When there was no dominant plaque composition, the plaque was classified as mixed. Volumetric data were generated by the software using Simpson's method. EEM and lumen CSAs were measured. P&M CSA was calculated as EEM minus lumen CSA. Plaque burden was calculated as P&M divided by EEM CSA. VH-IVUS analysis classified the color-coded tissue into four major components: green (FT); yellow-green (FF); white (DC); and red (NC).1)10-12) VH-IVUS analysis was reported as a percentage of plaque area or volume. We defined TCFA as a NC ≥10% of the plaque area in at least 3 consecutive frames without overlying fibrous tissue in the presence of ≥40% plaque burden.1)
Statistical analysis
The Statistical Package for the Social Sciences (SPSS) for Windows, version 15.0 (SPSS Inc., Chicago, IL, USA) was used for all analyses. Continuous variables were presented as the mean value±1SD; comparisons were conducted by a Student's t-test or nonparametric Wilcoxon test if the normality assumption was violated. Discrete variables were presented as percentages and relative frequencies. Comparisons were conducted by chi-square statistics or Fisher's exact test as appropriate. Multivariate analysis was performed to determine the independent predictors of TCFA. All variables with p<0.1 in the univariate analysis were entered into the multivariate analysis. A p of <0.05 was considered statistically significant.
Results
Baseline characteristics
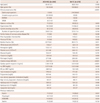
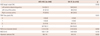
The baseline characteristics are summarized in Table 1. Patients with ACS had lower left ventricular ejection fraction, higher white blood cell count, higher fibrinogen, higher high-sensitivity C-reactive protein, higher low-density lipoprotein cholesterol, and higher apolipoprotein B levels compared with those with SA. There were no significant differences in previous medications between both groups.
Coronary angiographic findings
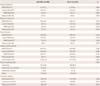
Coronary angiographic findings are as summarized in Table 2. There were no significant differences in target vessel, TIMI flow grade, reference vessel diameter, or minimal lumen diameter between both groups. ACS-NCL had lower diameter stenosis compared with SA-TL.
Gray-scale intravascular ultrasound results
Gray-scale IVUS results are summarized in Table 3. Plaque burden was significantly smaller at the proximal reference and at the minimum lumen site and at the largest NC site in ACS-NCL compared with SA-TL. Plaque morphology was significantly different between both groups. No significant differences were observed in volumetric parameters between both groups.
Virtual histology-intravascular ultrasound results
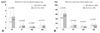
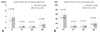
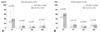
At the minimum lumen site, %NC and %DC areas were significantly greater. In contrast, absolute FF, and the %FT and %FF areas were significantly smaller in ACS-NCL compared with SA-TL (Fig. 1). At the largest NC site, although there were no significant differences in the absolute plaque areas, the %NC area was significantly greater in ACS-NCL compared with SA-TL (Fig. 2). Although there were no significant differences in the absolute plaque volumes, %NC volume was significantly greater in ACS-NCL compared with SA-TL (Fig. 3). TCFA was observed more frequently in ACS-NCL compared with SA-TL (27.6% vs. 18.1%, p=0.032).
Independent predictors of thin-cap fibroatheroma
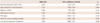
Multivariate analysis was performed to identify the independent predictors of TCFA and the results are summarized in Table 4. The following variables were tested (all with p<0.10 in univariate analysis), including clinical presentation (ACS vs. SA), diabetes mellitus, white blood cell count, fibrinogen, high-sensitivity C-reactive protein, low-density lipoprotein cholesterol, and minimum lumen site plaque burden. Independent predictors of TCFA by multivariate analysis were ACS {odds ratio (OR): 2.204, 95% CI: 1.321-3.434, p=0.021} and high-sensitivity C-reactive protein (OR: 1.101; 95% CI 1.058-1.204, p=0.035).
Discussion
The present VH-IVUS study demonstrated that 1) ACS-NCL had a greater %NC area and %DC area compared with SA-TL at the minimum lumen site, although the plaque burden was significantly smaller in ACL NCL, 2) ACS-NCL had a greater %NC volume and more TCFA compared with SA-TL, and 3) independent predictors of TCFA included ACS and high-sensitivity C-reactive protein.
Previous studies have reported the most important mechanism leading to an ACS as plaque rupture with subsequent thrombus formation.13)14) Plaque components may play a pivotal role in the plaque disruption and thrombosis that leads to acute coronary events.15)16) Several VH-IVUS studies have reported that ACS patients in their culprit site had more NC-containing lesions and more TCFA compared with SA patients in their target site.1-4) Additionally, some studies have reported that patients with ACS-NCL had more vulnerable plaque characteristics compared with NCL in those with non-ACS.17)18) Kunimasa et al.17) reported that ACS patients had computed tomography-low-density plaques more frequently in their non-culprit coronary arteries than did non-ACS patients, and the minimum computed tomography density within the plaque was significantly lower in ACS patients than that in non-ACS patients. Kato et al.18) reported that NCL in the ACS subjects, as compared with non-ACS, had a larger lipid volume, a thinner fibrous cap, and a higher prevalence of TCFA, and more frequent thrombus and macrophage. Therefore, ACS patients have vulnerable plaque in their NCL as well as at their culprit sites.
To date, no studies have compared plaque characteristics between ACS-NCL and SA-TL. In the present study, ACS-NCL had greater NC components and more TCFA compared with SA-TL, and ACS was the one of the independent predictors of TCFA. The PROSPECT study,19) using 3-vessel gray-scale and VH-IVUS in ACS patients, demonstrated that 46.7% of ACS patients had VH-TCFA in their NCL. Kato et al.18) reported that the prevalence of TCFA by optical coherence tomography in NCL was 64.7% in ACS patients and 14.9% in non-ACS patients. Kubo et al.20) reported that the prevalence of TCFA by optical coherence tomography in NCL was 38.5% in ACS patients and 6.3% in non-ACS patients. Jang et al.21) reported that TCFA was observed more frequently in ST-segment elevation myocardial infarction (72%) and non-ST-segment elevation myocardial infarction/unstable angina (50%) than in SA (20%) at their culprit sites. In the present study, TCFA was observed more frequently in ACS-NCL than SA-TL (27.6% vs. 18.1%). ACS is a consequence of the simultaneous development of vulnerable plaques in the whole coronary artery system and also a pan-vascular process with a higher prevalence of vulnerable plaques in NCL.17)18) Therefore, ACS development is associated with the formation of vulnerable plaque both in the culprit site and NCL.
In the present study, high-sensitivity C-reactive protein was the independent predictor of TCFA. Several studies have demonstrated the relationship between C-reactive protein and the prevalence of TCFA.22-25) Burke et al.22) reported the relationship between C-reactive protein and the number of TCFAs in patients who experienced sudden death associated with severe coronary artery disease. Our group reported that TCFA within culprit lesions was observed most frequently in patients with the highest high-sensitivity C-reactive protein tertile, and there existed a correlation between high-sensitivity C-reactive protein level vs. NC components and TCFA.23) Increased inflammatory response can cause atherosclerosis, which can destabilize the lesion and evoke clinical cardiovascular disease.26,27) C-reactive protein may directly participate in atherogenesis and the development of vulnerable plaque, regardless of clinical presentation (ACS vs. SA). Therefore, ACS treatment should focus not only on stabilizing the culprit lesion but also on the systemic stabilization of NCL.
There are several limitations in this study to be mentioned. First, the analyses were retrospective and subject to the limitations inherent in this type of clinical investigation. Second, gray-scale and VH-IVUS imaging were performed at the discretion of the individual operators, leading to potential selection bias. Third, we did not attempt to differentiate between atherosclerotic plaque and thrombus, because VH-IVUS could not determine the presence of thrombus. This may obscure the identification of TCFA. Fourth, heavily calcified plaques may induce an artifact regarding the codification of plaques by VH-IVUS, resulting in an increase in NC content. This remains a potential limitation of the present VH study. Fifth, the majority of patients in the ACS group suffered from unstable angina pectoris (80%) and most of the baseline characteristics were similar between the SA and ACS groups. Therefore, we may not have found significant differences in the plaque characteristics between ACS and SA patients.
In conclusion, ACL-NCL had a more vulnerable plaque component compared with SA-TL, although the plaque burden was significantly smaller in ACL-NCL, and ACS and high-sensitivity C-reactive protein were the independent predictors of TCFA. These results support the notion that plaque vulnerability is a pan-vascular process in ACS patients. These findings suggest that aggressive medical therapy with statins or other anti-inflammatory therapy should be considered if there are additional atherosclerotic lesions in NCL as well as at culprit site in ACS patients.
 XML Download