

 PDF
PDF ePub
ePub Citation
 Print
Print


Introduction
Percutaneous coronary intervention (PCI) has been a pivotal treatment for acute myocardial infarction (AMI). Despite the successful restoration of epicardial coronary artery flow, a substantial amount of microvascular damage remains and affects patient prognosis.1)2) The index of microcirculatory resistance (IMR) is a well-validated measure of microvasculature function in the human heart.3-6) A recent study has demonstrated that a simple invasive pressure-only test measuring the change of fractional flow reserve (FFR) value (designated as ΔFFR0.8) from a specifically designated value of 0.8 had a significant relationship with the extent of non-viable myocardium.7) However, the relationship between this modified FFR value and the IMR has not been investigated prospectively. The aim of this study was to evaluate the association between the FFR0.8 and the IMR immediately after PCI for AMI.
Subjects and Methods
Study population
Forty-eight patients who underwent PCI for AMI were recruited prospectively during the period April 1, 2012 through December 31, 2012. AMI was diagnosed by typical ischemic chest pain and elevated cardiac troponin I (TnI) with a rise and fall pattern, according to the third universal definition of myocardial infarction.8) Patients were eligible if they had a target lesion in the proximal to mid segments of one of the major epicardial coronary arteries and successful stent(s) treatment. We excluded patients with left main disease, cardiogenic shock requiring inotropic support, the presence of an additional lesion (>50% in diameter stenosis) distal to the target site, a severely tortuous vessel unsuitable for wire placement, and who had undergone previous coronary artery bypass surgery. This study was approved by the local ethics committees and all patients provided informed consent.
Study protocol
All patients were pretreated with 300 mg aspirin, 600 mg clopidogrel followed by maintenance doses of 100 mg/day of aspirin and 75 mg/day of clopidogrel. Patients received an initial bolus of 5000 units of unfractionated heparin intravenously and additional heparin to maintain an activated clotting time of 250-300 seconds during the procedure. Right atrial pressure (Pv) was measured with a 5 Fr right Judkins diagnostic catheter via the femoral vein. PCI was performed using a 7 Fr guiding catheter. When a large thrombus was present on an initial coronary angiography, manual aspiration thrombectomy using a 7 Fr Thrombuster II® catheter (Kaneka Corporation, Osaka, Japan) was performed with or without abciximab administration at the operator's discretion. All culprit lesions were treated with stent(s). Cardiac enzymes were measured at 8 hours after PCI and followed up for at least two days.
Intracoronary hemodynamic measurement
After PCI, 200 µg intracoronary nitroglycerin was administered to avoid coronary spasm. A 0.014-inch PressureWire® (St. Jude Medical, MN, USA) was introduced and equalized with the aorta pressure. The tip pressure sensor was advanced across the stented segment, and at least beyond the mid-to-distal portion of the culprit vessel. An undersized short balloon, which was smaller by 0.5 mm in diameter and 8-15 mm in length, was placed within the deployed stent and inflated to achieve a specifically designated FFR value of 0.8 in the resting state. After securing a steady-state FFR value of 0.8, hyperemia was induced with 140 µg/kg/min of adenosine infusion through the femoral vein. Aortic pressure (Pa) and distal intracoronary pressure (Pd) were obtained at maximal hyperemia. The FFR0.8 was defined as the value of FFR in the hyperemic state with the calibrated in-stent balloon obstruction to create the FFR value of 0.80 in the resting state. An adjunctive or stent balloon was used to form a total occlusion of the culprit artery and obtain coronary wedge pressure (Pw). A conventional FFR value (the ratio of Pd/Pa without in-stent balloon obstruction) was obtained after balloon extraction. The mean transit time (Tmn) was determined by three injections of 3 mL of room temperature saline while the guiding catheter was engaged. IMR was calculated as Tmn×Pd. IMRtrue was calculated using (Pa-Pv)×Tmn (Pd-Pw)/(Pa-Pw) to account for collateral flow and Pv.4) All the measurements were obtained during the state of hyperemia.
Statistical analysis
All continuous variables are expressed as mean±standard deviation or median (interquartile range) for non-parametric data. A Student t-test or Mann-Whitney U test was used for comparison. Categorical variables were presented as numbers with proportions and compared using a chi-squared or Fisher's exact test. Linear regression analyses were performed to evaluate the associations between the variables. Skewed variables underwent log transformation for analysis. An optimal IMR cut-off value for predicting the FFR0.8 <0.70 was determined by receiver operating characteristics (ROC) analysis. A 2-tailed value of p<0.05 was considered significant. Statistical analysis was performed using Stata for Windows (version 12.0, StataCorp, College Station, TX, USA).
Results
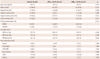
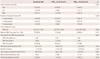
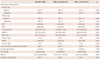
A total of 48 patients with AMI were subject to analyses. Patients were divided into two groups based on the FFR0.8 value of 0.70. Baseline clinical characteristics are listed in Table 1. Overall, the mean age was 60±12 years and 36 (75%) patients presented with ST-segment elevation myocardial infarction (STEMI). The most common culprit arteries in both groups were the left anterior descending coronary artery in both groups (Table 2). There was no difference in regard to the number of diseased vessels, symptom onset to balloon time, baseline Thrombolysis in Myocardial Infarction (TIMI) flow grade, reference lumen diameter, and number of stents used between the two groups. Patients who had a lower FFR0.8 (<0.70) had a trend toward a higher post-procedural TIMI flow grade and more receiving collateral flow. Coronary physiological data are outlined in Table 3. Among 8 patients (1 in the higher FFR0.8 group and 7 in the lower FFR0.8 group), Pw was not available. Pv was measured in 33 patients (16 in the higher FFR0.8 group, 17 in the lower FFR0.8 group) and did not differ between the two groups with a mean value of 14±6 (15±6 vs. 13±5, p=0.148). IMRtrue could be calculated in 32 patients because 16 patients did not have either a Pv or Pw value. The FFR, Pw, distance between the sensor and catheter tip, Q-wave after PCI, peak creatine kinase-myocardial band (CK-MB), and left ventricular ejection fraction (LVEF) did not differ between the two groups. The lower FFR0.8 group had a higher Pd, and a lower Tmn, IMR, IMRtrue, and peak TnI concentration.
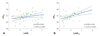
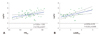
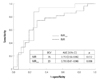
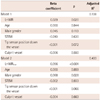
In the univariate analysis, the FFR0.8 had a marginal positive correlation with the log-transformed IMR (LnIMR) (r2=0.073, p=0.063), and a statistically significant positive correlation with the log-transformed IMRtrue (LnIMRtrue) (r2=0.276, p=0.002) (Fig. 1). There were statistically significant correlations between the FFR0.8 and the log-transformed peak TnI (LnpTnI) (r2=0.119, p=0.017), and the LnIMRtrue and the LnpTnI (r2=0.225, p=0.006) (Fig. 2). Both the LnIMR and the LnIMRtrue remained in a significant correlation with the FFR0.8 after adjustment for age, the male gender, tip sensor position down the vessel, and culprit vessel (Table 4). ROC analysis discovered an optimal cut-off value of 35 for IMR {sensitivity 74%, specificity 71%, area under the curve (AUC)=0.713, p=0.012} and 23 for IMRtrue (sensitivity 88%, specificity 75%, AUC=0.785, p=0.006) in predicting FFR0.8 ≥0.70 (Fig. 3).
Discussion
In this study, we found a statistically significant positive relationship between the LnIMRtrue and FFR0.8 measured immediately after coronary stenting for AMI. This relationship was maintained after adjustment for relevant covariates. Both the FFR0.8 and the LnIMRtrue also had a positive correlation to the LnpTnI, with statistical significance. Microvascular integrity is considered as a prerequisite of viable myocardium, which in turn, contributes to left ventricular (LV) function and clinical outcomes in patients suffering from AMI.9)10) With technological advancements, it became feasible to evaluate microvascular function in a catheterization laboratory using an intracoronary pressure wire. Traditionally, FFR has been used to determine the significance of an epicardial coronary artery stenosis in angina patients. Basically, the FFR measured during hyperemia reflects the amount of recruitable microvascular flow, and will decrease as the amount of viable myocardium increases. Thus, the value will be larger in patients suffering from AMI because of a lack of viable myocardium.11) Conversely, at a given stenosis in the coronary artery, the lower FFR implies a greater amount of viable myocardium remaining. Theoretically we need some degree of stenosis to estimate the quantity of viable myocardium by FFR. Therefore, we created an artificial balloon obstruction within the stented segment after revascularization. What degree of stenosis is optimal for assessing myocardial viability?
Kocaman et al.12) suggested that the delta FFR (ΔFFR), which was derived by subtraction of the FFR in hyperemia from that in the resting state, may represent the microvascular compensatory function in response to an epicardial coronary artery stenosis. ΔFFR had the greatest value in the intermediate stenosis (FFR 0.75-0.80). Where the FFR was >0.80 in the resting state, there was not a sufficient compensatory response during hyperemia. Where the FFR was <0.75, there was a blunted response because of the already existing ischemia in the resting state. Artificially creating a stenosis with a balloon to obtain the intermediate obstruction at the resting state gave rise to the notion of FFR0.8. The FFR0.8 is the value of FFR in a hyperemic state, with the partially inflated balloon used to create the specific normalized FFR value of 0.80 in the resting state. Using this method, Kim et al.7) demonstrated that the lower FFR0.8 value (FFR0.8 <0.70) endorsed the larger amount of viable myocardium on cardiac magnetic resonance imaging with the best discriminating value of FFR0.8=0.70.
On the other hand, IMR was a well-validated measure of representing microvascular function both experimentally and clinically.3)13) However, the relationship between FFR0.8 and IMR is not well understood. Furthermore, the reference value for the discrimination of viable myocardium against non-viable myocardium has not been adequately investigated. Fearon et al.14) suggested that the IMR ≤32 was an independent predictor of the recovery of LV function at three months among 29 patients who had undergone primary PCI for STEMI. In another study, where 40 patients with an anterior wall STEMI were enrolled, an IMR value of 33 was suggested as an optimal cut-off value for the improvement of LV function and viable myocardium assessed by positron emission tomography imaging.6) More recently, a study using CMR showed a higher median IMR value of 35 with microvascular obstruction compared to the value of 27 without obstruction among STEMI patients.5)
Our study demonstrated that the LnIMRtrue had a positive correlation with the FFR0.8 and this relationship remained even after the adjustment of several relevant covariates. In addition, the relationship between the logarithmic IMR itself and the FFR0.8 was found to be significant after considering covariates. Both of those values were associated with the peak TnI. Our best optimal value of IMR predicting FFR0.8 ≥0.7 was 35. This value was surprisingly close to the previously suggested values. These results support the notion that myocardial viability might be evaluated using only a pressure-wire either by IMR or FFR0.8 in a catheterization laboratory immediately after revascularization for AMI.
Interestingly, one subject had a FFR0.8 value of 0.82, which lay above the baseline value of 0.80. He had a high IMR (72 U), Pv (16 mm Hg), Pw (41 mm Hg), and low LVEF (32%), as well as Q wave on the electrocardiography. All of these findings indicated that he had a very large-sized myocardial infarction. The reason for this over-high FFR0.8 value after hyperemia could not be fully understood. However, it may be partially explained considering that his large-sized infarction hindered the FFR0.8, which declined in response to the hyperemia remaining of the same value of 0.80. Some measurement error had provided a slightly higher value of 0.82.
It is notable that the relationship of the IMR with CK-MB varied across prior studies. We could not locate any relationship between those two values. This might be explained by patient selection, wherein we did not face any time limitations for inclusion. Thus, in those who presented later, CK-MB may have been washed out while TnI remained at a high level due to its slower clearance rate.
Limitations
This study has several limitations to be noted. First, the small number of patients limited our capacity to determine an association among interesting factors, including collateral flow and LV function. Second, there was a lack of comparison with any imaging scan assessing myocardial viability in a direct way. However, those associations had been validated previously, and might be used in an inferred manner. Third, this study was conducted in a single center and the measurements of Tmn were performed by one sole operator. Thus, the findings need to be confirmed by other studies. Forth, the equation for calculating IMR uses Tmn to estimate coronary flow. The inverse correlation of Tmn with absolute flow could only be maintained when the sensor was located ≥6-8 cm from the catheter.15) We paid attention to the sensor position remaining in the distal third of the vessel. Nevertheless, the IMR measurements could have varied considerably on the sensor and catheter position, as well as the vessel volume. This effect might have accounted for the less robust relationship between the values with limited agreements. The additional balloon obstruction to obtain the FFR0.8 might be a cumbersome procedure. However, the FFR0.8 can be obtained at any interested point in the coronary artery, even within 6 cm from the catheter, and is not sensitive to vessel volume. These advantages of the FFR0.8 enabled us to estimate microvascular function where the IMR proves unsuitable.
In conclusion, there was a positive correlation between the LnIMRtrue and the FFR0.8 in AMI patients with statistical significance. Both of the values were associated with the peak TnI. The FFR0.8 and the IMR may prove to be useful surrogate measures of microvascular function after AMI.
 XML Download