

 PDF
PDF ePub
ePub Citation
 Print
Print


Introduction
Despite the concerns over its reliability, measurement of blood pressure (BP) in the clinic remains an essential activity in the management of patients with hypertension. Clinic BP measurement (CBPM) remains crucial to the management of hypertension among patients with physical or cognitive impairments who are not able to perform home BP monitoring (HBPM) and among those in resource-poor communities who cannot afford HBPM devices. The white-coat effect, masked hypertension, physiological variability and interobserver variability are important factors that undermine the reliability of CBPM.1)2) Thus, efforts to improve the validity and reliability of CBPM are beneficial to patient care.
Using average readings obtained from 2 or more measurements is one of the strategies aimed at improving the validity of CBPM. This is outlined in most clinical guidelines.3)5) At present, there is no recommendation on the maximum number of repeated measurements required to determine an average BP reading in clinical practice. While average readings are desirable, an important concern is that repeated inflation and deflation of the cuff cause discomfort to the patient. Hence, in the absence of clinical evidence and guidance (and possibly under the influence of available technology), conducting repeated measurements may be an unwarranted procedure in an attempt to obtain average readings for better reflection of the patient's actual BP. In addition to subjecting patients to avoidable discomfort, this would lead to wastage of patient and personnel time and energy.
Thus, the optimal number of BP readings which can confer the benefit of average measurements without subjecting patients to undue discomfort should be determined. Comparison of average readings derived from a high number of sequential measurements with those from a few number of measurements could provide some evidence and direction on the optimal number of BP readings.
The aim of this study was to compare average BP readings obtained from 5 measurements with averages obtained from 2, 3, or 4 sequential measurements using an automated oscillometric device (that discards the first BP reading) at a general outpatient clinic.
Our objectives were to: 1) evaluate the relative proportion of clinically significant differences that exist between an average of five readings (systolic and diastolic, respectively) and each average derived from a fewer number of readings; 2) compare the relative proportion of systolic and diastolic readings falling within <140 mm Hg or ≥140 mm Hg, and <90 mm Hg or ≥90 mm Hg classes, respectively, for the average of 5 readings and each average from fewer readings; 3) evaluate the correlation between an average of 5 readings (systolic and diastolic, respectively) and each of the averages derived from fewer readings.
Subjects and Methods
This study employed a descriptive cross-sectional design. We conducted BP measurements on 410 consenting adult patients attending the general outpatient clinic at the Department of Family Medicine, Lagos State University Teaching Hospital, Lagos, Nigeria. The clinic is a first contact care unit at which all non-emergency cases are first evaluated. Immediate and continuing treatments as well as referral services are provided by the clinic.
The Sample size was purposive, and the participants were consecutively recruited during clinic sessions. The study was approved by the Institution's research ethics committee. We invited participants by requesting the clinic Nurse to gather patients who agreed to undergo automated BP measurements with a device that takes 6 readings in a designated office. The purpose of the exercise as well the discomfort associated with repetitive cuff inflation and deflation were explained to each intending participant.
We included adults aged 18 years and over, who were willing to voluntarily participate. Exclusion criteria were: the presence of acute medical conditions, finding of irregular pulse rhythm on pulse palpation, a mid-upper arm circumference greater than 42 cm (oscillometric devices are unreliable in persons with arrhythmias or midupper arm circumference >42 cm), and cigarette smoking or coffee ingestion on the day of examination.
All BP measurements were conducted in a quiet office by a trained research assistant (an intern) on consenting patients in the sitting position after a 5-minute rest using a BpTRU blood pressure measurement (BPM)-100 device (VSM medical technologies, Vancouver, Canada) following the updated American Heart Association guidelines for office BP measurements.4) Prior to the provision of consent, patients were informed about the number of readings that would be taken by the device, the purpose of the exercise and the average duration of time required for the measurements (about 20 minutes). After completion of the first measurement, the patient was left alone in the office. Patients were instructed not to make any movement during the measurements and to call on the research assistant using the bell after the procedure was completed at the end of the 6th reading.
The BpTRU is an automated oscillometric BP measuring device that is designed to conduct 6 consecutive BP readings. The time interval between measurements can be pre-set at 1, 2, or 3 minutes. The interval between measurements has been shown to have no effect on the readings obtained by this device.6) For the present study, the interval was set at 1 minute for all measurements to ensure that subjects committed only the minimum time feasible to the study. After completing 6 sets of measurements, the first reading was discarded and the mean of the latter 5 was computed and displayed as the average BP. All the readings were digitally displayed. The average reading as well as the 2nd to 6th readings could be recalled with the playback button. The BpTRU passed validation with an A/A rating on the British Hypertension Society protocol.7) This device was chosen for the study because of the need to obtain repetitive sequential measurements with an automated validated instrument that can conduct the procedure without the input of the patient or clinical staff; thus eliminating observer bias and reducing the white-coat effect.
Data on participants' age, sex, and the 2nd to 6th readings were recorded in a database. Information on cigarette smoking and alcohol use as well as previous diagnosis and treatment of hypertension and diabetes were also documented. Averages of sequential measurements were computed (respectively for systolic and diastolic readings) as follows: 2nd and 3rd readings as average of 2 (Av2), 2nd to 4th readings as average of 3 (Av3), 2nd to 5th readings as average of 4 (Av4), and 2nd to 6th as average of 5 (Av5).
Differences (expressed as absolute values) between Av5 and each of Av4, Av3, and Av2 were evaluated for systolic and diastolic components, respectively. These differences were then classified into 2 groups, viz.: 0-5 mm Hg and >5 mm Hg. Classification of these differences was done to evaluate the relative proportion of clinically non-significant differences between Av5 and the averages derived from fewer readings.
The concept of clinically significant differences was adapted from protocols for validating automated oscillometric devices.8)9) In these protocols, differences between compared readings which fall within 0-5 mm Hg are designated as clinically insignificant.8)9) Furthermore, Bland-Altman's analysis was conducted to evaluate the 95% limits of agreement for the differences between the compared readings.
Differences between Av5 and each of Av4, Av3, & Av2 in the relative proportion of systolic and diastolic readings falling within the classes of <140 mm Hg or ≥140 mm Hg and <90 mm Hg or ≥90 mm Hg, respectively, were evaluated for statistical significance. This was done to compare the effect of using Av5 or the alternative average readings on hypertension-related decision making in the general outpatient setting. We conceptualized that in this setting, the clinician would utilize 140/90 mm Hg as the reference point for assessing control among known hypertensives (uncomplicated) or consideration of the diagnosis of hypertension among yet undiagnosed patients.
Correlation between Av5 (systolic and diastolic components respectively) and each of the corresponding components of Av4, Av3, & Av2 was evaluated with Pearson's correlation coefficient. This was conducted to assess the degree of agreement/scatter between Av5 and each of the averages derived from the less numbers of readings.
Data analysis was performed using GraphPad Prisms version 5 for windows. Data were evaluated with descriptive statistics. Comparison of continuous variables was done with independent t-tests and analysis of variance (ANOVA), while comparison of proportions was performed with Fisher's exact test and the chi-square test, as appropriate. For all statistical tests, a p<0.05 was considered statistically significant.
Results
Of 410 sets of readings, 397 (96.8%) were error-free and contained the second to sixth readings. These were analysed. BP data of 13 (3.2%) participants were excluded from the analysis due to incompleteness. Participants' age ranged from 18 to 86 (49.20±11.06) years. There were 228 (57.4%) females. Males were aged 21-74 (50.89±12.19) years, median=54 years; while females were aged 18-86 years (47.95±9.98), median=50 years, p=0.0086 (independent t-test). Thirty percent (n=119) of the participants were known hypertensives; nearly one-quarter (n=29) of these reported had taken BP medications prior to the clinic visit. A non=statistically significant difference was found in the proportions of male and female participants who had hypertension. About 10% of the subjects (n=38) had been diagnosed with diabetes mellitus, while those who were current cigarette smokers or current alcohol users made up 4% (n=16) and 22.9% (n=91) of the analysed population, respectively.
All the compared readings are presented in Table 1. Differences among the means of these readings (systolic and diastolic respectively) were non-significant (p>0.05, ANOVA). Also, for systolic and diastolic readings, respectively, Dunnett's multiple comparison tests found non-statistically significant differences in the comparisons of Av5 with each of the other average readings.
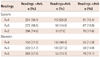
The distribution of the compared readings relative to Av5 (Table 2) showed that for both systolic and diastolic readings, Av2 had the highest proportion of readings that were >Av5, while Av4 had the highest proportion of readings that were ≤Av5. For systolic and diastolic readings, respectively, statistically significant differences were found in all pairs (Av4/Av2, Av4/Av3, & Av2/Av3) of comparisons for the distribution of readings relative (i.e., > or ≤) to Av5: χ2 ranged from 9.3-117.5, p≤0.01 for all.
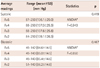
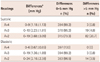
Absolute differences between Av5 and each of Av4, Av3, and Av2 are shown in Table 3. For systolic readings, about four-fifths of the differences were within the clinically insignificant 0-5 mm Hg range, while for the diastolic readings over 95% of the differences were clinically insignificant. For readings derived from 3 or 4 measurements, <5% of all systolic and diastolic differences were found to be clinically significant. Sub-set analysis showed that differences between Av4 and Av3 were within the clinically insignificant range for both systolic and diastolic readings in all subjects (100%).
Table 4 shows the distribution of the readings from all the averages under comparison relative to the BP value of 140/90 mm Hg. The differences between the distributions obtained for Av5 and others were all less than 5% for both systolic and diastolic readings. The data also showed that as the number of readings increased, more readings fell under the <140 mm Hg and <90 mm Hg categories for systolic and diastolic BP, respectively. However, this trend was found to be non-statistically significant. Also, differences between the distributions obtained for Av5 and each of the compared averages were statistically non-significant (p>0.05 for all, Fisher's exact test).
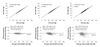
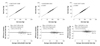
Statistically significant strong positive correlations were found in all comparisons between Av5 and the others (r≥0.9, p<0.0001 for all). Also, in the sub-set analysis (not depicted), the correlation between Av4 and Av3 was strong and statistically significant (r≥0.9, p<0.0001). Correlation scatter plots with associated coefficients (Pearson's correlation coefficients) and Bland-Altman's plots are shown in Figs. 1 and 2 for systolic and diastolic readings, respectively. Near-perfect correlations are clearly depicted.
In Bland-Altman's analysis, the mean difference (bias) between Av5 and each of Av4, Av3, and Av2 and their corresponding standard deviations were -0.83 (1.48) mm Hg, -1.50 (2.43) mm Hg, and -2.95 (3.93) mm Hg for systolic readings, while those for diastolic readings were -0.42 (1.06), -0.79 (2.03), and -1.59 (2.92) mm Hg. The 95% limits of agreement for the difference between the compared readings ranged from 2-7 mm Hg for systolic readings and 2-11 mm Hg for diastolic readings. Although for both systolic and diastolic readings, widening of the 95% agreement limits with reduction in the number of readings was observed; Bland-Altman's plots (lower panels in Figs. 1 and 2) showed that scattering away from the bias line with increasing BP was more pronounced for systolic than diastolic BP, and this was unaffected by the number of readings.
Discussion
This comparative study found strong correlations between the average of 5 sequential BP readings and the averages of 2, 3, or 4 sequential readings for both systolic and diastolic components. Also, it was shown that the use of any of these alternative averages as a substitute for the average of 5 readings would not have significant effect on the assessment of hypertension or its control for the undifferentiated outpatient population in this study. This finding is further buttressed by the fact that for both systolic and diastolic BP, the differences between the average of 5 readings and the averages derived from 3 or 4 readings were clinically insignificant in over 95% of subjects. Also, the differences between the average of 5 readings and the averages of 3 or 4 readings respectively had clinically acceptable 95% limits of agreement for both systolic and diastolic BP. However, the averages derived from 2 readings had clinically insignificant differences in 79.3% and 96.5% of systolic and diastolic readings, respectively. Thus, based on the algorithm employed by this device, average BP values derived from 3 or 4 sequential measurements appear to be clinically equivalent to those derived from five sequential measurements for both systolic and diastolic components.
Our findings also suggest that in this model, in which the first BP reading was excluded, the average of the next 3 readings seem optimal because in addition to being strongly concordant with the average of 5 readings, a sub-group analysis found a similarly strong concordance with the average of 4 readings. Exclusion of the first reading hinges on the assumption that the first reading may be relatively high because of the effects of physical and psychological stress which would wear off as the patient relaxes while the cuff is still attached. However, the last reading may also be increased and deviated because repetitive measurements may cause tiredness, pain in the arm, annoyance and anxiety. Thus, conferment of theoretical benefits of excluding the first reading would not justify acquisition of an excessive number of readings.
To our knowledge, no published study has hypothesized about the minimum number of readings that would be useful for BP determination for the general outpatient population. Also, no previous study examining our specific research question was found. However, studies addressing the related aspects of repeated (serial) repeated office blood pressure (ROBP) were reviewed. Using a ROBP protocol involving 10 sequential readings at 2.5-minue intervals, Crippa et al.10) demonstrated the value of ROBP in the evaluation of BP control for patients with hypertension.11) However, their findings suggested that a higher number of readings would be desirable because the average of the last five readings had a better correlation with the readings from ambulatory blood pressure measurement (ABPM). While this may hold true for the assessment of BP control particularly when compared with ABPM, the use of 10 sequential readings in routine clinical practice will be logistically challenging in most outpatient clinics. Likewise, the cost of ABPM and the challenges associated with its use (particularly physical interference and sleep disturbances which are patients' most common complaints)12) would limit its applicability to selected patient groups in clinical settings with sufficient resources. Thus, identification of a minimum number of ROBP which can optimally benefit patient care and BP reliability remain a valid research problem.
The recent introduction of the 30-minute office blood pressure measurement (OBPM) is another novel development in the subject of ROBP measurement. This entails the use of the average of 6 ROBP taken at 5-minute intervals using an ABPM device after discarding the first two readings.13)14) Although evidence has shown that this approach produces readings which are lower than standard OBPM14) and produces readings which agree strongly with daytime ABPM readings,13) no study has evaluated the concordances between the means of fewer readings in this model and the average of 6 of readings. However, in the first report on this method by van der Wel et al.13) they noted that mean 10-minute measurements was only modestly (but not significantly) higher than mean 30-minute OBPM, while mean 15-, 20-, and 25-minute OBPMs were not different from mean 30-minute OBPM. However, evaluation of the concordance between each of these and daytime ambulatory BP was clearly beyond the scope of their objectives.13)
In ROBP models, the total time expended on BP measurement is strongly influenced by the resting interval between serial readings. For the 30-minute OBPM the investigators opted for 5minute rest interval because this was the lowest feasible rest interval on the device employed. The BpTRU device used in this study has resting interval options of 1, 2, and 3 minutes. We opted for the 1 minute interval because intervals between measurements have been shown to have no effect on the readings obtained by this device.6)
The 30-minute OBPM has also been said to have the potential to detect the white-coat effect and masked hypertension. It should be noted that the BpTRU device employed in this work has also been shown to have the ability to reduce the white-coat effect because it discards the first reading and can be used by all cadres of health workers whose presence are not required during measurements.15)16) We performed the analysis based on the exclusion of the first reading in keeping with the default design of the BpTRU and to align our discussion with most previous ROBP studies that excluded the first reading.
The strengths of this study include the large sample size which confers reliability on the statistics obtained. The wide range of systolic and diastolic BP values involved broadens the applicability of the current findings to the general patient population amongst whom wide BP ranges are often encountered. The use of a validated automated BP device excluded human errors and measurement bias. Limitations of this study include the use of a device which excludes the first reading in computing the average BP. This would limit the applicability of the results to BP measuring systems that exclude the first reading. Thus, further generalizations would await the findings of similar studies which will include the first reading in the analysis. Non-oscillometric devices (mercury manometers, aneroid devices etc.) are still widely employed in clinical practice (particularly in resource-constrained settings); our findings may not be applicable to such measurement models. The non-availability of ABPM (due to resource constraints) made impossible the evaluation and comparison of the agreements between different average values and ABPM.
Considering that most guidelines recommend the use of average readings obtained from multiple measurements without suggesting the optimal number of repeated readings, an important contribution of this study is that it illuminates the possibility that ROBP measurements can be associated with excessive readings which are non-beneficial to the patient and clinical practice. This is corroborated by the findings of a recent study by Powers et al.17) which showed that while an average of multiple readings could help reduce short term variability in systolic BP measurements in the home, clinic or research setting (among a cohort of mostly males with uncontrolled hypertension), the reduction in within-patient variance was greatest in the increase in the number of readings from 1 to 2, then diminished rapidly as the number of measurements increased; very little additional reduction in variance was seen beyond 4-6 systolic BP measurements. Thus, the overall clinical significance of the findings of our study is that we have demonstrated that in a BP measurement model in which the first reading is discarded, the use of averages of subsequent 2, 3 or 4 readings may suffice for routine CBPM. Further research is needed to determine the optimal number of readings for assessing average BP in the clinic setting because reliable approximation of an average clinic BP to each patient's true BP will require simultaneous comparison with out-of-clinic measurements.
In conclusion, our data revealed a strong concordance and mostly clinically insignificant differences between the averages of 2, 3 or 4 readings and the average of 5 readings. We also observed a similarly strong concordance between the averages of 3 and 4 readings. However, the proportion of clinically significant differences between the average of 5 readings and those of 2 readings (systolic BP) which fell well beyond the statistically acceptable limit of 5% is clinically relevant.

 XML Download