

 PDF
PDF ePub
ePub Citation
 Print
Print


Introduction
Assessment of subclinical target organ damage is a key element in the evaluation of patients with primary hypertension.1-3) Microalbuminuria (MAU) and reduced estimated glomerular filtration rate (eGFR) has been proposed as a useful integrated marker of subclinical target organ damage and increased cardiovascular (CV) risk. However, routine evaluation of MAU and eGFR is not recommended by international guidelines as part of the diagnostic work-up of every hypertensive patient, so its independent assessment power has not been fully exploited in clinical practice.1-3)
Increased arterial stiffness predicts cardiovascular disease (CVD) in patients with primary hypertension.4) Thus, the recently published guidelines for the management of hypertension have adopted measurement of arterial stiffness by pulse wave velocity (PWV) to evaluate subclinical target organ damage.5)
Many studies demonstrated the combined predictive power of MAU and eGFR on arterial stiffness in primary hypertensives,1-3) but not their independent association with arterial stiffness.1-3) There is increased risk of CVD in eGFR less than 60 mL/1.73 m2, but very little research exists on arterial stiffness in minimally reduced eGFR (60≤eGFR<90 mL/1.73 m2) according to National Kidney Foundation Kidney Disease Outcomes Quality Initiative (NKF KDOQI™) guideline.6)
To address this, we conducted this study with measurements of eGFR, MAU and arterial stiffness in never-treated hypertensives with normal or minimally reduced kidney function {i.e. eGFR (>60 mL/min/1.73 m2) plus no macroalbuminuria}. All subjects were categorized to four groups based on eGFR and MAU. To measure arterial stiffness, we used heart-femoral pulse wave velocity (hfPWV), which has a close correlation with aortic stiffness.7) The aim of the present study was to investigate the independent predictive power of MAU and minimally reduced range of eGFR (60≤eGFR<90 mL/1.73 m2) on subclinical target organ damage, namely arterial stiffness in never treated hypertensive patients.
Subjects and Methods
Study subjects and design
Enrolled were 491 untreated hypertensive patients. They underwent a routine medical history, anthropometry (including measurement of height and weight), a physical examination, and CVD risk assessment including blood and urine examination and measurement of the hfPWV. The blood samples for laboratory analyses were obtained after overnight fasting. The serum creatinine measurement was conducted in the laboratory with a single method (Jaffe method). eGFR was calculated using the Modification of Diet in Renal Disease (MDRD) equation {eGFR (mL/min/1.73 m2)=186×(serum creatinine in mg/dL)-1.154×(Age)-0.203×(0.742 if female)}.
A single morning voided urine sample at the baseline examination was used to measure the urinary albumin-to-creatinine ratio (UACR). Urinary creatinine concentration was measured using a modified Jaffe method (kinetic colorimetric assay, Roche Diagnostics). Urinary albumin concentration was assessed using immunoturbimetry (Tina-quant Albumin assay, Roche Diagnostics).
Urinary albumin-to-creatinine ratio was divided in two categories like a normal albuminuria: men <25 µg/mg creatinine, women <35 µg/mg creatinine and MAU: men 25≤UACR<300 µg/mg creatinine, women 35≤UACR<300 µg/mg creatinine. On the other hand, normal eGFR was divided in two categories like a minimally reduced eGFR: 89.9-60 mL/min/1.73 m2 and normal eGFR: ≥90 mL/min/1.73 m2 according to NKF KDOQI™ guideline.6) Participants were categorized into four groups based on the presence or absence of minimally reduced eGFR and/or MAU as a Group 1; eGFR ≥90 mL/min/1.73 m2 (normal eGFR) and normo-albuminuria (NAU), Group 2; eGFR 89.9-60 mL/min/1.73 m2 (minimally reduced eGFR) and NAU, Group 3; normal eGFR and MAU, Group 4; minimally reduced eGFR and MAU.
Cardiovascular disease and risk factors assessment
Hypertension was defined as a systolic blood pressure of 140 mm Hg or higher and diastolic blood pressure of 90 mm Hg or higher. The mean of the two readings taken by an examining physician was used for the systolic and diastolic blood pressure measurements. Current smoking was defined as current smoking or cessation of smoking less than one year before the study visit. Body mass index (BMI) was calculated by the formula; BMI=weight (kg)/height (m2). Mean arterial pressure (MAP) was calculated by the formula; MAP={(2×diastolic blood pressure)+systolic blood pressure}/3.
Heart-femoral pulse wave velocity
Pulse wave velocity was performed in the supine position after 5 minutes of bed rest using an automatic wave form analyzer (VP-2000; Colin Co., Komaki, Japan), which simultaneously records pulse waves, blood pressure, electrocardiogram (ECG), and heart sounds. Cuffs with an oscillometric pressure sensor were applied to the extremities, ECG electrodes were attached to both wrists, and a microphone for phonocardiography was placed at the second intercostal space on the left border of the sternum. Pressure waveforms of carotid and femoral arteries were recording using multiple element tonometry sensors placed at the left carotid and left femoral arteries. The wave form analyzer measures time interval between S2 and the dicrotic notch of the carotid pulse (ΔThc) and the foot of the carotid pulse and the foot of the femoral pulse (ΔTcf), The sum of ΔThc and ΔTcf is the time for pulse waves to travel from the heart (aortic orifice) to the femoral artery (ΔThf). Also, the wave form analyzer automatically determines the distances between the two recording sites on the basis of the subject's height using the following formulas; the distance from the heart to the femoral artery (Lhf)=0.5643×height (cm)-18.381. PWVs were calculated automatically according to the following equations: hfPWV=Lhf/ΔThf.
Exclusion criteria
Subjects with the following conditions were considered ineligible. 1) Patients with macroalbuminuria; 2) more than moderate renal dysfunction as assessed by eGFR values of <60 mL/min/1.73 m2; 3) secondary hypertension; 4) angina pectoris; 5) myocardial infarction; 6) heart failure (New York Heart Association class III and IV); 7) stroke 8) significant arrhythmia.
Statistical analyses
Quantitative values were expressed as mean±SD. Analysis of variance (ANOVA) test and chi-square tests were used for the evaluation of differences in mean values of four groups. For comparison of the four groups of hfPWV, estimates were adjusted by age, gender, BMI, heart rate, MAP, level of total cholesterol and current smoking status. Null hypotheses of no difference were rejected if p were less than 0.05.
We used multivariate linear regression analysis to examine the association of eGFR, UACR and arterial stiffness (hfPWV). UACR was log-transformed to normalize its skewed distribution. Three multiple linear regression models were fitted (all subjects, normoalbuminuria group, and normal GFR group). The coefficients (beta) were calculated by Pearson chi-square. The association between the eGFR and hfPWV was assessed by analysis of covariance controlling for age, gender, BMI, heart rate, MAP, level of total cholesterol and current smoking status in each three models. On the same method, the association between the logUACR and hfPWV was assessed in three models. All analyses were conducted using the Statistical Package for the Social Sciences (SPSS) software (11.0J for Windows, SPSS, Chicago, IL, USA).
Results
Baseline characteristics of the subjects
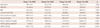
The demographic and baseline characteristics of the subjects are summarized in Table 1. Enrolled in this study were 491 participants. There were 249 (50.7%) in group 1, 162 (32.9%) in group 2, 52 (10.5%) in group 3 and 28 (5.7%) patients in group 4. The mean age was 50.1±10.4 years (group 1, 48.7±10.1; group 2, 52.3±10.5; group 3, 48.8±9.9; group 4, 52.3±11.3). 60.1% (300/491) were men. Other baseline characteristics (BMI, current smoker, total cholesterol, glucose level, serum creatinine, UACR, eGFR) of four groups are summarized in Table 1.
Comparison of blood pressure, heart rate and heart-femoral pulse wave velocity
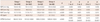
Of the 491 subjects, MAP was 118.9±12.6 mm Hg (group 1, 117.7±11.9; group 2, 117.9±11.7; group 3, 126.8±18.8; group 4, 126.5±17.2). Mean heart rate was 69.2±10.8 beats per minute (group 1, 69.2±10.6; group 2, 66.9±10.2; group 3, 71.2±11.7; group 4, 67.1±9.2). Mean hfPWV value was 995.8±169.2 cm/s and group 1 showed lowest hfPWV (964.6±145.4 cm/s) (cf. group 2, 1013.5±168.9; group 3, 1058.2±238.0; group 4, 1065.8±162.9). Analysis adjusting age, sex, BMI, heart rate and MAP showed significantly lower hfPWV was found in group 1 compared to group 2 (p=0.032), 3 (p=0.007) and 4 (p=0.087). There was no difference of hfPWV in group 2 and 3 (p=0.423) (Table 2).
Independent factors affecting heart-femoral pulse wave velocity
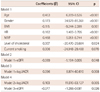
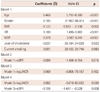
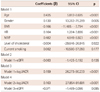
Multiple regression analysis of all subjects (Table 3) showed that hfPWV was independently associated with logUACR {beta=0.096, 95% confidence interval (CI)=8.974-60.610, p=0.008} and eGFR (beta=-0.069, 95% CI=-1.194 - -0.005, p=0.048). The association was not changed by mutual adjustment with eGFR and logUACR. Separate analysis for the NAU alone group (Table 4) and normal eGFR alone group (Table 5), yielded the same results. eGFR was independent risk factor of arterial stiffness in NAU group (beta=-0.099, 95% CI -1.408 - -0.154, p=0.015) and logUACR was significantly correlated with arterial stiffness in normal eGFR group (beta=0.159, 95% CI 26.273-90.233, p<0.001). In conclusion, a strong association of MAU and/or minimally reduced eGFR with arterial stiffness was noted in all subjects, NAU group, and the normal eGFR group.
Discussion
The present study provides an independent evaluation of the relationship between increased arterial stiffness and minimally reduced eGFR and/or MAU in never treated primary hypertensives. Our results indicate that arterial stiffening is independently associated with minimally reduced eGFR and MAU. These results agree with previous studies of high risk patients with moderate or severe renal dysfunction patients.8-10) However, our results are important because patients with more than moderate renal dysfunction as assessed by eGFR values of <60 mL/min/1.73 m2 were excluded and we assessed the independent impact of MAU and eGFR on arterial stiffness.
Many reports find increased risk of CVD when eGFR is less than 60 mL/1.73 m2, but few studies have investigated arterial stiffness in minimally reduced eGFR (60≤eGFR<90 mL/1.73 m2).8-11) Bian's study showed that carotid-femoral PWV and Augmentation index increased on going from the top to the bottom eGFR tertile in Chinese women with normal kidney function.8) Astor et al.11) also noted that both lower eGFR and MAU increased CV mortality, but they compared moderately decreased eGFR (eGFR <60 mL/1.73 m2) with normal eGFR (>90 mL/1.73 m2). Recent several large studies have considered CV risk associated with early kidney disease. In the community-based Prevention of Renal and Vascular End-Stage Disease Study, a study of over 40000 participants conducted in the Netherlands, urinary albumin concentrations as low as 10-20 mg/liter were associated with a higher risk of CV mortality than were urinary albumin concentrations less than 10 mg/liter.12) Another study found that very low levels of MAU were associated with increased risk of coronary heart disease. In that study, urinary albumin excretion in the upper quartile (>4.8 µg/minute, approximately equivalent to 7.2 mg/g) was associated with a two-fold higher risk of coronary heart disease than urinary albumin excretion in the lowest quartile (<2.1 µg/minute).13) But they examined only change of MAU, not considered eGFR. Our study provides more detailed information about arterial stiffness and early kidney dysfunction in never treated hypertensives.
There are several potential mechanisms to explain the link between arterial stiffness and kidney functions.14-17) Chronic inflammation, increased oxidative stress, disorders of calcium-phosphate metabolism, activation of the renin-angiotensin system, and volume retention are some of the putative mechanisms for increased arterial stiffness in advanced kidney disease.14)15) The increased plasma levels of asymmetric dimethylarginine and of homocysteine in individuals with mild renal insufficiency may increase arterial stiffness via endothelial dysfunction.16)17)
The development of subclinical CV organ damage is a powerful independent predictor of CV prognosis.3) Thus, early detection of CV organ damage in clinical practice is important in primary hypertension patients.3) Arterial stiffness is an established, independent predictor of subclinical organ damage and CV mortality.4) It can be assessed noninvasively by measurement of PWV, a simple and reproducible method.7) Some studies directly demonstrated that PWV was an independent predictor of all-cause and CV mortality in patients with primary hypertension.4) Boutouyrie et al.18) reported recently that in a cohort of 1045 hypertensives, PWV remained an independent predictor of CV events after adjustment for coronary risk scores. Several mechanisms explain the association between increased arterial stiffness and CV events.18-20) Arterial stiffness is correlated with atherosclerosis, probably through the effects of cyclic stress on arterial wall thickening.19) It is also associated with left ventricular hypertrophy, a risk factor of coronary events in hypertensive patients.18)19) It is a cause of premature return of reflected waves in late systole, increasing central pulse pressure and load on the ventricle, reducing ejection fraction.18)
Some studies noticed a more pronounced increase in PWV with increasing age.21-24) Several studies found a significant interaction with arterial stiffness and eGFR differed by age.21-24) In younger subjects, all measures of eGFR are associated with risk of CV events.25) In contrast, in the elderly, no measures of eGFR calculated by estimating equations are independently associated with CV risk. For example Raymond et al.23) have shown that the relative risk of mortality for decreasing eGFR lessens with increasing age (at age >75 years). Tomiyama et al.26) reported that the age-related increase in arterial stiffness increased by severity of hypertension. Our study subjects were diagnosed as hypertensives but not treated (MAU groups had higher blood pressure level than NAU groups) and mean age was 50.1±10.4 years. It mean relative younger patient was enrolled our study, so eGFR and MAU were a significant interaction with arterial stiffness. Future studies may be focus on interplay between arterial stiffness and early kidney disease differs from age.
This study has some limitations. First, we had only one time measurement of arterial stiffness and were not able to longitudinally assess the relationship between changes in arterial stiffness and kidney function. Second, there may be misclassification of individuals with eGFR close to 60 mL/min/1.73 m2, because the MDRD study equation used in our study underestimates GFR in individuals without chronic kidney disease. Finally, in our study, there was a difference of sample size among groups. So we calculated ANOVA one-way power analysis to test whether the statistically difference was really significant. In a one-way ANOVA study, sample sizes of 248, 162, 52, and 28 are obtained from the each 4 groups and we achieve 100% power to detect differences among the each groups (power should be close to one. hfPWV power calculation: group 1 vs. group 2; 0.99815, group 1 vs. group 3; 0.99024, group 2 vs. group 3; 0.98493, group 1 vs. group 4; 0.80628). Our sample size calculations gave us adequate power to detect modest associations.
In this study, we observed independent interaction between MAU and minimally reduced eGFR with arterial stiffness. Higher urinary microalbumin excretion only was associated with a higher risk within each category of eGFR, and, similarly, minimally reduced eGFR was associated with a higher risk for arterial stiffness among patients with and without MAU. These elevated risks remained strong even after adjustment for numerous factors, including with age, gender, BMI, heart rate MAP, total cholesterol level and current smoking status. Our study has important clinical and research implications. The presence of minimally reduced eGFR or MAU is independently associated with increased arterial stiffness, indicating greater CVD risk. Thus, simultaneous measurement of eGFR and urine microalbumin is needed in the risk assessment of hypertensive patients, although they have normal kidney function.
 XML Download