

 PDF
PDF ePub
ePub Citation
 Print
Print


Introduction
Atherosclerosis and microvascular disorders are two contrasting manifestations of pathophysiologic blood flow. The flow in large arteries is characterized by higher velocities of 10-70 cm/s at peak systole.1-4) Since both flow velocity and lumen diameter vary greatly throughout the systemic circulation, a dimensionless number called the Reynolds number can be used to describe the hemodynamic character of vascular flow. It is defined as ρVd/µ, where ρ and µ are the density and viscosity of blood, respectively, V is flow velocity, and d is lumen diameter. The Reynolds number represents the ratio of inertial forces (i.e., kinetic energy) to the viscous forces in flow. For example, the Reynolds number corresponding to large-arterial flow is in the range of 100-850.5) In other words, the inertial forces are 100-850 times greater than the viscous forces primarily in such a flow regime due to the higher flow velocity.
The microvascular network is far more intricate than the large arteries and is crowded with a number of branches and anastomoses in a small space. In arteriole flow, the corresponding Reynolds number is on the order of 0.0006 due to lower flow velocities and smaller diameters, indicating that the viscous forces are about 1,600 times greater than the inertial forces in the arteriole regimes.5) For capillary flow, the corresponding Reynolds number is approximately 0.001-0.0005 with a flow velocity in a range of 0.05-0.1 cm/s.1-4) At capillaries, hematocrit levels have been reported to be as much as 21% lower than systemic hematocrit levels (33±7% vs. 42±6%, respectively).6) Not only is hematocrit reduced at the capillaries, but viscosity levels are also lower at capillaries relative to systemic viscosity because of the Fähraeus-Lindqvist wall effect at the capillary.1)7) Despite these factors, the Reynolds number still holds an order of magnitude of 0.001 at the capillaries, indicating that viscous forces are about 1,000 times greater than inertial forces.
In consideration of the fluid mechanical framework above, it is helpful and altogether correct to postulate that blood flow in the microvasculature is essentially determined by viscous forces, i.e., the viscosity of blood. The objective of the present paper was to provide an in-depth review of how the rheological properties of blood affect microvascular flows. The present paper underscores yield stress as the key rheological property of blood which modulates the microvascular flow. Furthermore, the paper discusses how whole blood viscosity (WBV) is related to the yield stress and proposes a framework for establishing critical thresholds for pathophysiologic diastolic blood viscosity (DBV) levels which may trigger the onset of microvascular disorders.
Hemorheology
Hemorheology is the study of blood flow in a vessel with an emphasis on the behavior of the erythrocytes as they interact and as quantifiable biophysical patterns emerge from the interactions of erythrocytes in the vascular system. As whole blood consists of cells and plasma, the blood is a vigorous organ and behaves as a non-Newtonian fluid, where the fluid viscosity varies with shear rate.2-4)8) Note that the shear rate represents the ratio of fluid velocity to lumen diameter. The main reason why whole blood exhibits non-Newtonian viscosity is due to the presence and interaction of blood cells. In many engineering fluids containing micron-size solid particles (such as paints), the maximum concentration of suspended particles is about 50%; beyond this concentration, the fluid-mixture stops flowing due to its high viscosity.9) In contrast, whole blood flows relatively easily through blood vessels even at erythrocyte concentrations much higher than 50% because of the flexible membrane of erythrocytes.9) Hence, any condition that alters normal erythrocyte physiology can have a major adverse impact on blood flow.
Blood viscosity is the inherent resistance of blood to flow and represents the thickness and stickiness of blood. The blood becomes stickier when it moves slowly during diastole, whereas it becomes thinner when blood moves quickly during systole, a phenomenon which is described as the shear-thinning, non-Newtonian behavior of whole blood.8)10)11) Blood viscosity represents a dynamic property of blood, whereas hematocrit, lipid profiles, glucose, creatinine, plasma proteins, osmolality, among others, represent static properties of blood. The dynamic range of WBV is relatively large, i.e., 40-450 mP,8)10)11) which highlights the potential utility of this parameter as a biomarker-to the degree that viscosity provides additional incremental prediction of clinical outcomes and is modifiable by therapeutic modalities.
The viscosity of a fluid represents the friction between a moving fluid and stationary wall. Left-ventricular motion of the heart provides the blood pressure necessary to overcome the friction exerted by moving blood on arterial walls. As such, all other conditions held equal, a relative increase in WBV for a given patient will, by necessity, represent an increased burden of work to the heart.
Due to the non-Newtonian characteristics of blood, its viscosity varies greatly with time during a cardiac cycle. In addition, WBV varies with the anatomical configuration of an artery. For example, the diameter of the coronary artery is about 3 mm, whereas that of the aorta is approximately 2.5 cm.2-4) Thus, the WBV at the coronary artery is different from that at the aorta because of different shear rates at the two locations. Shear rate γ̇ is defined as ~8V/d, where V is flow velocity and d is lumen diameter. As blood passes through a bifurcation, blood decelerates along the outer wall of the bifurcation, greatly reducing the local shear rate at the outer wall. This causes WBV at the outer wall of the bifurcation (i.e., a low-shear-rate area) to be much greater than that at the wall of the main lumen (i.e., a high-shear-rate area), a phenomenon which can cause endothelial dysfunction and is described in greater detail below.12)
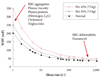
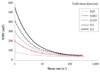
When blood moves through large arteries, blood viscosity profiles are decreased relative to other segments of the vasculature, i.e., blood becomes thinner as erythrocytes are fully dispersed due to higher flow velocity in large arteries. Blood viscosity values corresponding to the high flow velocity is defined as the systolic blood viscosity (SBV), analogous to systolic blood pressure. SBV is measured at a shear rate of 300 s-1 and has a normal value of about 3.8 cP (38 mP) (Fig. 1).3)8)10)11)13-19) A small increase in SBV will not affect the overall flow in the large arteries, since the viscous forces are almost negligible compared with the inertial forces in the large arteries2-4) as mentioned above.
The DBV is the viscosity corresponding to low flow velocity as experienced in microcirculation. This is the viscosity of blood measured at a low shear rate of 5 s-1 or less. In patients presenting with essential hypertension,20) myocardial infarction,20)21) ischemic stroke,22)23) or PAD,24) the DBV levels have been observed to be higher than that of healthy controls. The DBV in normal human subjects is about 20 cP (200 mP) at a shear rate of 1 s-1 (Fig. 1),3)8)10)11)13-19) which is about five times greater than the SBV. One of the reasons why DBV is much greater than SBV is that erythrocyte aggregation occurs when blood moves very slowly in a small vessel. Both fibrinogen and low density lipoprotein-cholesterol (LDL-C) molecules promote erythrocyte aggregation.10)25) Fibrinogen is a long chain molecule with length of approximately 47-48 nm and molecular weight of 340,000 daltons and adheres to the membrane surface of erythrocytes.26)27) As erythrocytes at lower shear rates cluster and crowd together, fibrinogen molecules form a cross-linking network structure, encouraging erythrocyte aggregation.10)11)28)29)
The erythrocyte surface has about 200 binding sites for LDL-C or high density lipoprotein-cholesterol (HDL-C) molecules.30) The distance between two aggregated erythrocytes is about 19 nm due to red blood cell electrostatic repulsion. In order for erythrocytes to aggregate, a bridging molecule with a diameter greater than 19 nm should simultaneously bind to two erythrocytes.30) Since LDL-C molecules have diameters of 18-30 nm, they can bind to two adjacent erythrocytes, thus promoting the aggregation, encouraging rouleaux formation of erythrocytes,31) which directly increases DBV. In contrast, the size of HDL-C is only 5-12 nm so that it is too small to simultaneously bind to two erythrocytes.25) When HDL-C bind to these binding sites, the binding sites are not available for LDL-C. Acting in this way, HDL-C suppresses erythrocyte aggregation and accordingly reduces DBV.30)31) In addition, LDL-C molecules can decrease erythrocyte deformability by increasing the cholesterol-to-phospholipid ratio at the erythrocyte membrane,30) resulting in the increased SBV. Glucose, osmolality, and dehydration all adversely affect the erythrocyte membrane, making the membrane stiff, and thus increasing the blood viscosity.
Fig. 1 shows a normal blood viscosity curve (see triangular symbols)3)8)10)11)13-19) together with two blood viscosity curves (see two open symbols) obtained from two apparently he-althy male adults both with hematocrit of 45%. These two isolated cases are shown here to highlight the dynamic range of blood viscosity profiles and their biochemical and cellular determinants. The high shear blood viscosities were relatively similar in the two cases, whereas a large difference was observed in the low shear blood viscosities. The two most important parameters that influence the blood viscosity profile are hematocrit (Hct) and plasma proteins (i.e., fibrinogen); lipid profiles such as LDL-C, HDL-C and triglyceride also affect low-shear blood viscosity more poignantly than high-shear viscosity.10)
Hematocrit is the volume fraction of erythrocytes in whole blood. As the Hct increases, the friction will increase between moving blood and the arterial wall, resulting in an elevated WBV. A paradigmatic example is the clinical entity of polycythemia vera, where hematocrit can be 60-65% or greater.10) At such high Hct, WBV increases exponentially with Hct. The relationship between the hematocrit and SBV was described by Hall32) and can be expressed by the following equation:33)
where H is given as the volume fraction, i.e., % divided by 100.
Oxygen Delivery Index
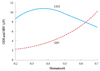
Since the red cells carry hemoglobin molecules, one may think that the higher the hematocrit, the more oxygen that the whole blood can deliver. Indeed, this is a sensible line of reasoning which has been the basis of several large randomized controlled studies of erythropoietin as a therapeutic modality for reducing cardiovascular outcomes for patients with kidney insufficiency.34-37) However from a hemodynamic perspective, elevated hematocrit can increase the friction of the whole blood and actually reduce the ability of blood to transport hemoglobin. Therefore, in order to quantify this delicate balance, hemorheologists have developed a parameter known as the oxygen delivery index (ODI), which is calculated as the ratio between the hematocrit and SBV.38)

where H is the volume fraction of erythrocytes.
Fig. 2 shows the ODI curve vs. Hct calculated using Hall's SBV data which is superimposed in the figure.32) In this particular case, the optimum ODI occurs in a range of Hct of 0.37-0.38, which is significantly less than the conventional values for normal Hct, especially for males (i.e., male: 0.4-0.54; female: 0.37-0.47). The reason why the optimum ODI occurs at Hct lower than the established normal values is due to the exponential increase in SBV with increasing Hct. This was confirmed by Usami et al.39) who similarly found that the Hct level for optimal hemoglobin transport was 0.38 for humans, using WBV data obtained at a shear rate of 52 s-1. Note that the optimum Hct of 0.38 is only valid for flow in large arteries, where the flow velocity of blood is large enough to uniformly disperse erythrocytes. In this regard, Alexy et al.40) reported that in a low-shear-rate flow where the flow velocity is relatively very small, the ODI linearly decreased with the Hct. In other words, for microvascular flow regimes, the smaller the Hct, the more efficiently the oxygen can be transported. Kenyeres et al.41) performed Kaplan-Meier survival analysis on the impact of the ODI on cardiac mortality (p=0.009), stating that the ODI showed significant negative correlation with the frequency of hospital admissions (r=-0.377, p=0.03) and low ODI could be regarded as a risk factor of cardiac death in coronary heart disease.
Shear Stress
Stress is defined as the force per unit area, and the hemodynamic wall shear stress, also called vascular shear stress or endothelial shear stress, represents the frictional shear force exerted by moving blood upon unit area of arterial wall. The adjective "shear" means frictional or tangential. Mathematically, the shear stress τ is defined as the product of fluid viscosity µ and shear rate γ̇ as described by the following equation:3-5)11)
In a straight segment of a large artery, where blood moves at a high velocity, the wall shear stress has a value of 15-70 dyne/cm2 under normal physiological conditions.2)4)12) Endothelial cells respond positively to normal physiologic shear stress by remaining in their elongated phalanx formation, generating endothelial NO synthase (eNOS) mRNA and atheroprotective gene expression, but decreasing endothelin-1 (ET-1) messenger ribonucleic acid (mRNA).12)42)
With decelerated flows-acute or chronic, the blood recirculates and oscillates at the outer wall of bifurcations. Vascular shear stresses at the outer wall then periodically change from normal physiologic levels to low pathophysiologic levels, i.e., ≤4 dyne/cm12)43) Endothelial cells exposed to low vascular shear stresses lose their elongated phalanx formation and adopt a rounder profile, negatively responding to oscillatory low shear stresses by favoring the uptake of oxidized LDL-C, up-regulating ICAM-1, VCAM-1, MCP-1, E-selectin, TNFα, bone morphogenic protein-4 (BMP-4), while decreasing eNOS mRNA and protein expression.12)42)43) Throughout the literature, pathophysiologic low shear stresses are associated with augmented expression of inflammatory genes responsible for increased synthesis of endothelial-localized adhesion molecules, transmigration of mononuclear cells into subendothelial space, and intrusion and incorporation of lipoproteins into tissue macrophages.44-49)
Shear Rate
Shear rate γ̇ is defined as the velocity gradient, dV/dr, which represents the ratio of the blood flow velocity V to lumen diameter d. For a Newtonian fluid, it can be expressed by the following equation:2)5)10)

For a non-Newtonian fluid such as blood, the constant is slightly greater than 8.10)33) The shear rate in a large artery is in the range of 100-2,000 s-1 during systole.2)4)10) As the shear rate increases above 300 s-1, WBV decreases to a minimum asymptotic value because the erythrocytes are uniformly dispersed by high blood velocity. At the minimum asymptote, a Newtonian viscosity of 3.8 cP (38 mP) is obtained in normal subjects (Fig. 1); this value can be used for the wall shear stress calculation for the flow in the large artery as the first approximation.
For the flow regimes in both arterioles and capillaries, the corresponding shear rates are also in the high range of 400-1,600 s-1 which is due to relatively small lumen diameters (i.e., less than 60 µm).4)6)50) In contrast to these high shear rates, the flow velocities are rather small (i.e., less than 0.1 cm/s) such that the erythrocytes cannot be uniformly dispersed, and the conditions that produced the minimum asymptotic blood viscosity cannot be attained at the high shear rates. Instead, erythrocytes tend to aggregate, critically affecting the flow at the microvascular network.
In careful consideration of the above, the shear rate parameter alone should not be used to estimate the shear stress for microvascular flows. How then shall we estimate the shear stress in the flow regimes of microvascular network?
Yield Stress
The maintenance of the perfusion at small vessels such as capillaries is one of the most important challenges in the treatment of microvascular diseases. For example, diabetic retinopathy, nephropathy, and neuropathy are known for the poor perfusion at small microvessels, leading to capillary loss. These complications related to diabetes are included among a wide range of conditions that can be generally termed as microvascular disorders. Similar phenomena occur in other clinical entities such as hypertension and chronic renal failure, where the capillary density at myocardium has been reported to be significantly lower than that of normal subjects.51) In order to appreciate the cause of capillary loss in such cases, one can examine the forces involved in the flow at the capillary vessels.
A rheological property of blood particularly useful for the study of microvascular flow is the yield stress, τy. Homogeneous fluids which do not have suspended particles such as water or plasma do not have the yield stress, whereas fluids with suspended particles do have the yield stress. The yield stress can be defined as the limit of the shear stress when the shear rate approaches zero. Merrill and his co-workers described the yield stress as the minimum shear stress required to maintain the blood in continuous flow.52) Blood can approach a standstill in living circulation such as in post-capillary vessels with the occurrence of stasis or cessation of blood flow.53) The physical origin of the yield stress is the attractive forces (i.e., ion bridges, hydrogen bonds, electrostatic charges and van der Waals forces) among the particles suspended in a continuous medium, which permit rapid locking of the particles into three-dimensional networks.54) Hence, in order to have a continuous flow, the shear stress produced by the flow (or pressure) should exceed the yield stress.54)
Copley and King pioneered the first measurement of the yield stress of blood at a shear rate of 0.0009 s-1 with a Weissenberg rheogoniometer.53) The yield stress at Hct of 40% for normal blood at 37℃ varies in a range of 0.01-0.06 dyne/cm2.33)54-56) Picart et al.57) reported that the yield stress for normal blood was in a range of 0.05 to 0.06 dyne/cm2 for Hct of 60%, and 0.2 to 0.25 dyne/cm2 for Hct above 80%. There are several correlations which predict the yield stress of whole blood. Merrill and his co-workers52)58) proposed a correlation:
where the constant A of 0.6-1.2 represents fibrinogen concentration, the limiting hematocrit Hc given as a volume fraction is between 0.04 and 0.08, H is in a range of 0.3 and 0.5, and τy is in dyne/cm2. From this correlation, they reported that the typical yield stress for normal blood at Hct of 0.4 was 0.04 dyne/cm2. Zydney et al.59) proposed a correlation:
which gives the yield stress of 0.045 dyne/cm2 at Hct of 0.45. Picart et al.60) later proposed a correlation using the viscosity results of Chien et al.61) which gives the yield stress of 0.025 dyne/cm2 at Hct of 0.45:
For polycythemia, Errill58) reported a yield stress of 0.183 dyne/cm2 at Hct of 59.5%. Morris et al.62) reported that the yield stress increased at an accelerating rate in a range of Hct >60-65% for normal blood, reaching 0.25 dyne/cm2 at Hct of 80%. For systemic sclerosis, which is a typical microvascular abnormality, the yield stress was significantly greater than normal subjects (+56%, p<0.05 at Hct of 60%).63)
Shear Stress in Microvascular Flows
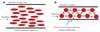
Fig. 3A depicts uniformly dispersed erythrocytes experiencing high velocity flow in a large artery. For flow in a capillary, erythrocytes tend to aggregate due to the attractive forces among the erythrocytes as depicted in Fig. 3B. When the attractive forces are greater than the shear forces (i.e., dispersing forces) created by the flow itself, hemostasis can occur locally due to the rapid interlocking of cells.54)58) Subsequently, capillary loss, one of the most common features of microvascular abnormalities, can occur.
As mentioned previously, the shear stress should not be estimated by τ=µγ̇ for microvascular flows, where viscous forces, not inertial forces, control the flow. Instead, the microvascular shear stress can be estimated by the following force balance equation:

where d and L are the diameter and length of a microvessel, respectively, and ΔP is the pressure difference across the capillary.5) In other words, the shear stress at a microvascular network should be determined without using either flow velocity and blood rheology. In normal physiology, the shear stress is much greater than the yield stress so that the perfusion at the microvascular network can be properly maintained. However, when the yield stress increases due to hyperviscosity such that the attractive forces among cells result in their rapid interlocking, local microvascular flow can be acutely impaired, resulting in capillary loss. It is intended that this force balance equation for microvascular shear stress can serve as a cornerstone of a framework for developing and establishing fluid dynamic biomarkers that are predictive of microvascular disease complications.
Capillary Network and Determination of Shear Stress
The capillary network is comprised of the pre-capillary arterioles, the capillary bed and the post-capillary venules, and furthermore is characterized by a high degree of structural heterogeneity as well as having a typically asymmetric and irregular distribution in the vasculature.64) The microvascular topography and complexity varies in different organs, presumably reflecting the different structural and functional features of specific tissues. The number of capillaries in the human body is extremely large and includes approximately 2×10⁹ capillaries.64)65)
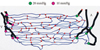
Fig. 4 shows an illustrated reconstruction of the capillary portion of microvascular networks,66) which shows vessel segments, nodes (branch points), the length and connectivity of each capillary segment up to capillary exits on the collecting venule. Capillary entrance (A) and exit (V) pressures were set to 20 mmHg and 10 mmHg, respectively.66) Pries et al.6) reported an average pressure drop across capillaries of 9.1±6.1 mmHg. Shea and Raskova67) reported their observations of a murine kidney microvascular structure with the afferent arteriole divided into five primary capillary segments similar to the structure shown in Fig. 4. They found the total capillary length in a range of 5-9 mm with a mean capillary segment length of 33±23 µm with a pressure drop of 12 mmHg across the capillary network.
The length of capillaries varies widely from organ to organ. The path length by which blood traverses the capillaries may actually be longer than the actual measured distance because of extensive anastomoses in the capillary network.68) In tissue regions with high metabolic demand such as in the retina and myocardium, the length of capillaries is relatively short but also with high capillary density, to better cope with temporarily insufficient or stagnating blood flow.65)68) McManus et al.68) measured the capillary length from terminal arteriole to collecting venule, which ranged from 0.1 to 3 mm with an average of 1 mm. Payman and Lyon69) reported that an absolute capillary length in murine utricular macula was 8.45±1.6 mm with a mean capillary diameter of 5.84±0.56 µm. In tissue with lower metabolic demand, the capillary is relatively long. For example, capillary lengths in skin capillary networks are 1-3 mm,65) whereas they are several hundred microns in the peri-macular capillary network.70) In particular, Lübbers and his co-workers71)72) demonstrated using animal models that capillary lengths in the kidneys can be very long, i.e., 100-550 mm.65) Pries et al.6) reported that the pressure gradient in murine mesentery capillaries was in the range of 0.1-0.5 mmHg/mm. The wall shear stress at the capillary can be determined using the pressure gradient of 0.1 mmHg/mm,6) as:

Determination of Yield Stress Using Casson Model
For the estimation of the yield stress, one can use the following constitutive equation called the Casson model:33)73)

where κ is a Casson model constant representing an asymptotic high shear viscosity and τy is the yield stress of blood. From the Casson model, one can derive the Casson viscosity equation as
Fig. 5 shows five typical blood viscosity curves as a function of shear rate with κ equal to 3.8 cP (38 mP), including a very low blood viscosity curve (bottom) and a very high blood viscosity curve (top). The second curve from the bottom with open circular symbols represents the normal blood viscosity curve.3)8)10)11)13-19) The yield stress could be determined from curve fitting of the viscosity curves using the above Casson vis-cosity equation. The calculated yield stress values are shown in Fig. 5. Note that the normal viscosity curve gave a yield stress of 0.065 dyne/cm2, in close agreement with previous studies.53-57) The dotted viscosity curve with a DBV of 300 mP at shear rate of 1 s-1 gave a yield stress of 0.125 dyne/cm2, whereas the dashed viscosity curve with a DBV of 412 mP gave a yield stress of 0.2 dyne/cm2.
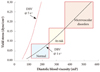
A hemodynamic diagnostic approach is proposed here, comparing the yield stress of a patient's blood with the microvascular shear stress which maintains perfusion: if the yield stress of a patient's blood exceeds the shear stress needed to maintain capillary flow, then ischemia and capillary loss may be triggered. Fig. 6 provides a theoretical case study showing how reference ranges for DBV and yield stress could be used to predict microvascular disorders. Fig. 6 gives yield stress values calculated using the Casson model for a range of DBV at shear rates of both 1 and 5 s-1, in solid and dashed lines, respectively. In general, the yield stress increases as the DBV increases. Using Pries' animal model for the vessel geometry and pressure gradient in capillary flow6) and the force balance equation for microvascular shear stress, the threshold value for microvascular wall shear stress is calculated to be 0.16 dyne/cm2, which would be the minimum shear stress necessary to maintain capillary flow and prevent spontaneous erythrocyte aggregation, in this example. A patient with a DBV greater than 400 mP at a shear rate of 1 s-1 would experience yield stress levels that approach 0.2 dyne/cm2. In such a case, depicted by the top rectangular box in Fig. 6, the shear forces are not large enough to prevent erythrocyte aggregation, potentially resulting in local hemostasis and the eventual loss of the capillaries. Normal physiologic yield stress levels of less than 0.08 dyne/cm2 are depicted using the bottom rectangular box in Fig. 6.
Final Remarks
The present review attempted to explain the cause of the capillary (length) loss, a common clinical outcome of microvascular disorders. Abnormally elevated DBV produces a counter-acting resistance to the flow at microvessels, and the relationship between DBV and the yield stress of blood was presented. Flow in the microvascular network was quantified in terms of the wall shear stress (WSS) under normal physiological conditions using the pressure gradient suggested by Pries et al.6) resulting in a calculated WSS threshold of 0.16 dyne/cm2 based on these assumptions. The present review proposed that when the yield stress is greater than the WSS, the flow at microvessels will stop, resulting in the capillary loss. The validity of the concept should be examined through clinical studies. For example, the myocardium perfusion can be determined using adenosine-stress dual-energy CT or MRI measurement, and the correlation between the myocardium perfusion and elevated DBV can be studied. Furthermore, the Casson viscosity equation was used to estimate the yield stress using a blood viscosity profile. Although the Casson equation is the most widely used model for blood viscosity, the use of a different model such as Herschel-Bulkley73) could give a different value for the yield stress. These competing models should also be compared through clinical trials.
 XML Download