

 PDF
PDF ePub
ePub Citation
 Print
Print


Introduction
Because the pulmonary vein (PV) plays an important role in atrial fibrillation (AF), pulmonary vein isolation (PVI) using high frequency energy is definitely an effective curative procedure for patients with AF.1-5) PV stenosis is a rare but critical complication associated with this procedure, and related symptoms can vary.6-9) The incidence of significant PV stenosis or total PV obstruction is 1 to 10% during a period of 1.3 to 15 months after PVI.10-12) Pappone et al.13-15) has reported that antral ablation is associated with high success and low complication rates, especially in paroxysmal AF, although it is only partly successful in chronic, persistent AF. Although computed tomography (CT) or magnetic resonance imaging (MRI) are currently the standard methods for predicting PV stenosis after PVI, radiation exposure and their costs remain drawbacks.
The aim of this study was to predict PV stenosis after PVI, and compare efficacy results and pulmonary venous flows (PVFs) using classical transthoracic Doppler echocardiography (TTE) in patients undergoing antral ablation (AA group) guided by an electroanatomic mapping system and patients undergoing ostial ablation (OA group).
Subjects and Methods
Subjects
The study population consisted of 105 individuals {M : F=64 : 41 (61% : 39%), mean age: 56±10 years} who underwent high-frequency catheter ablation for AF at St. Mary's Hospital, The Catholic University of Korea, between June 2005 and June 2006. All subjects complained of chest discomfort, and their AF had been refractory to medical treatment.
A total of 78 (74%) out of 105 enrolled patients had paroxysmal AF; whereas 27 (26%) had chronic, persistent AF. Out of 105 individuals, 30 (29%) underwent antral ablation assisted by an electroanatomic mapping system, while the remaining 75 (71%) patients underwent ostial ablation. The mean symptomatic period was 11±7 years, and the mean period of resistance to antiarrythmic agents, including (Category I or III, such as flecainide, propafenone, amiodarone), β-blockers, calcium channel blockers, or digoxin, was 2.8±4 years.
This study was approved by our Institutional Review Committee. The participants were informed of the investigative nature of the study, and written informed consent was obtained before enrollment.
Mapping and catheter ablation
Medical history before the procedure, physical examination, electrocardiography, and TTE, including PVF velocity were obtained for all patients. PV anatomy was assessed by integrating multidetector computed tomography (MDCT) images with an electroanatomic mapping system (CARTO; Biosense Webster Inc., Diamond Bar, CA, USA). Oral anticoagulants such as coumadin were taken 1 month before the procedure and stopped 5 days prior to it. All patients also underwent transesophageal echocardiography (TEE) to rule out left atrial thrombosis. The procedure was performed as follows. Four catheter insertion sites were obtained through the right jugular vein and bilateral femoral veins. A 10-electrode catheter was maneuvered into the coronary sinus through the right jugular vein, after which another 10-electrode catheter and a 6-electrode catheter were placed at the top of the right atrium and the bundle of His, respectively, through the right femoral vein. Finally, a pigtail catheter was placed at the right pulmonary artery through the left femoral vein, passing through the inferior vena cava, right atrium, and right ventricle. At this stage in the procedure, the outline of the PV was identified in a few seconds using selective biplane pulmonary angiography {right anterior oblique (RAO) 45°, left anterior oblique (LAO) 45°} from both the right and left sides. This anatomical image became the basis for the procedure. To isolate the PV through the left atrium, a Brockenbrough needle (Medtronic, USA) and two 8F SL1 long transseptal sheaths (St. Jude Medical, Daig Division, USA and Multipurpose, Medtronic, USA) were used to make two artificial atrial septal defects, and 5,000 IU of heparin was infused intravenously. The heparin dosage was chosen to maintain an activated clotting time of 300 seconds, measured every hour. The ablation technique for each patient was chosen as follows: ostial ablation using a Lasso catheter was performed in the first 75 patients (OA group) and then the antral ablation using the CARTOMERGE system was performed in the subsequent 30 patients (AA group).
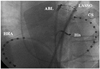
Ostial ablation group (Fig. 1)
A LASSO variable catheter (25 mm) (Biosense-Webster, Inc.) was placed at the ostium of the PV through a long branch of the left femoral vein. Then, under LASSO guidance, an 8 mm-tip ablation catheter (Biosense-Webster, Inc.) was placed 1-2 cm away from the ostium for ablation. In patients with atrial flutter, ablation was performed at the right atrial cavotricuspid isthmus.
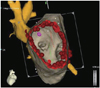
Antral ablation group (Fig. 2)
Mapping catheters (Navistar; Bioscience Webster, Inc., Belgium) were placed into each PV and pulled toward the left atrium. Then, the CARTOMERGE system was implemented, using the 3-dimensional real-time nonradioactive electroanatomic mapping CARTO system to obtain the structures of the left atrium and of the 2 PVs, which were integrated with MRI or CT images obtained before the procedure. When mapping was completed, a 30-mm or 35-mm LASSO catheter was positioned at the antrum of the left atrium, and ablation was completed by an 4 mm-tip ablation catheter (Navistar; Biosense-Webster, Inc.) under LASSO and CARTOMERGE guidance. Patients with atrial flutter underwent ablation at the cavotricuspid isthmus.
A Stockert 70 RF Generator (500 kHz; Stockert GMBH, Freiburg, Germany) was used to generate high-frequency energy, and the target temperature was set at 35℃ for each movement, every 10-20 seconds. The maximum energy was set at 60 W. Patients with AF during the procedure received intracardiac cardioversion using 5-10 J.
Echocardiographic indices
All TTE and TEE assessments were carried out using the Philips Sonos 5500 (Philips Healthcare, Andover, MA, USA) and General Electric System FiVe ultrasound imaging systems.
Transesophageal echocardiography
All patients were placed in the lateral supine position under mild sedation using intravenous (IV) midazolam 2-5 mg, and oximeter surveillance. TEE was performed using a multiplane transducer the day before PVI. The left atrial appendage was carefully examined for thrombosis, and a blood flow of 0.4 m/sec was considered safe for procedure.
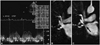
Transthoracic Doppler echocardiography (Fig. 3A)
All patients underwent TTE before and after PVI. The PVF velocities of the right and left PVs were calculated by pulse-wave Doppler in the apical 4-chamber view to compare incidence rates of PV stenosis and PVF changes between the AA group and the OA group. PV stenosis was defined as a postprocedural maximum PVF >110 cm/sec, corresponding to data published by Yu et al.16) After PVI, a decrease in PV diameter by ≥50% measured by CT or MRI was considered significant, and we compared pre- with postprocedure PV diameters (Fig. 3B and C). The rates of ablation success, symptom recurrence, complications such as pericardial effusion or cardiac tamponade, stroke, esophageal injury, and phrenic nerve injury were also recorded.
Statistical analysis
Statistical analysis was conducted using SAS statistical software, version 9.1 (SAS Institute, Cary, NC, USA), and the results were expressed as mean±standard deviation. Comparisons of PVF before and after the two different procedures, namely AA group with CARTOMERGE and the OA group without CARTOMERGE, were done using the paired Wilcoxon signed ranks test and the Mann-Whitney U-test. A p less than 0.05 was considered statistically significant.
Results
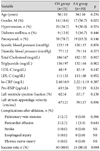
Clinical features (Table 1)
No patient complained of PV stenosis-associated symptoms. The success rates for the OA group and AA group were both 80.0% (n=60 and n=40, respectively), and the recurrence rates of the OA group and AA group were both 20.0% (n=15 and n=6, respectively). PV stenosis was only observed in the OA group (2.7%, n= 2), and pericardial effusion or cardiac tamponade was observed in 2.7% of patients from the OA group (n=2), and 3.3% from the AA group (n=1).
Echocardiographic results before and after the procedure (Table 1 and 2)
Left ventricular ejection fractions (LVEF, %) of the OA and AA groups were 62±6% and 63±7% (p=0.136), respectively, and left atrial appendage (LAA) velocities were 67±21 cm/sec and 59±17 cm/sec, respectively (p=0.936) (Table 1).
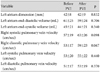
Left atrial dimension changes before and after the procedure were 42±8 mm and 42±9 mm (p=0.832), respectively. Left atrial end-diastolic volume (LAEDV) changes were 61±25 mL and 59±24 mL (p=0.706), respectively; left atrial end-systolic volume (LAESV) changes were 45±21 mL and 44±21 mL (p=0.340), respectively (Table 2).
Right systolic PVF velocity changes before and after the procedure were 57±19 cm/sec and 63±26 cm/sec (p=0.098), respectively, whereas the right diastolic PVF velocity changes were 53±17 cm/sec and 59±23 cm/sec (p=0.067), respectively. Left systolic PVF velocity changes before and after the procedure were 53±20 cm/sec and 55±22 cm/sec (p=0.440), respectively; left diastolic PV velocity changes were 51±17 cm/sec and 53±19 cm/sec (p=0.370), respectively (Table 2).
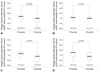
Peak systolic flow velocity changes of the right PV were significantly lower in the AA group (-6.7±28.1 cm/sec) using CARTOMERGE, compared to the OA group (10.9±25.9 cm/sec) without CARTOMERGE (p=0.038) (Fig. 4A). Similarly, peak diastolic flow velocity changes of the right PV were also significantly lower in the AA group (-4.1±17.0 cm/sec) than in the OA group (9.9±25.9 cm/sec) (p=0.021) (Fig. 4B). Peak systolic flow velocity changes of the left PV were -13.4±25.1 cm/sec and 9.2±22.3 cm/sec, for the AA and OA groups, respectively. The AA group had significantly lower values compared to the OA group (p=0.016) (Fig. 4C). The peak diastolic flow velocity changes of the left PV were also lower in the AA group (-4.4±25.2 cm/sec) than in the OA group (5.8±22.4 cm/sec), but the difference did not achieve statistical significance (p=0.447) (Fig. 4D).
Two patients in the OA group had PVF velocities of 118 cm/sec and 133 cm/sec detected by TTE. By MRI assessments, the maximum stenosis of their PVs were 62.5% and 50.0%, respectively (Fig. 3B and C).
Discussion
Although high-frequency PVI is an effective procedure for treating patients with AF, complications associated with this procedure include PV stenosis, atrio-esophageal fistula, peri-esophageal vagal nerve damage, postablation atrial tachycardia, thromboembolism, air embolism, and cardiac tamponade. In our study, there were no cases of atrio-esophageal fistula, peri-esophageal vagal nerve damage, postablation atrial tachycardia, or thromboembolism; however, there were cases of PV stenosis (n=2, 1.9%) and cardiac tamponade (n=3, 2.7%).
To diagnose these complications, various methods, including CT, MRI, TEE, lung ventilation perfusion scanning, eso-phagography, and esophageal manometry can be used.6-9) Our study, however, documents the effectiveness of TTE in diagnosing PV stenosis before and after ablation, by comparing TTE measurements with MRI measurements. Recently, Packer et al.17) reported that intracardiac echocardiography can be useful for assessing endocardiac structures during PVI and preventing PV stenosis after the procedure. Also, Saad et al.18) stated that progression of PV stenosis is rare three months after the procedure, and if it occurs, is usually stable or improves gradually. Various approaches using high-frequency catheter ablation, including PVI, PV denervation, elimination of anchor points, vein of Marshall exclusion, elimination of AF arising from the posterior LA, and reduction of antral volume, have been introduced to treat patients with AF according to its diverse etiology.19-24)
Left atrial circumferential ablation, also known as "circumferential PVI," was first attempted by Pappone et al.13)14) and refers to "figure-of-eight" ablation around the two left and two right PVs. The use of antral ablation to treat AF has been the subject of controversy. Stabile et al.25) reported a success rate of only 37% in 51 patients; whereas Oral et al.26) reported a high success rate of 88%. However, in our study, the AA group and the OA group showed equivalent success rates of 80%, and although the difference did not achieve statistical significance, only the OA group developed PV stenosis (n=2, 2%).
There are several possible reasons for the high success, low recurrence, and low complication rates in the AA group of this study. First, center experience should be considered. There are reports that even highly successful centers initially have a low success rate. Second, the type of high-frequency energy source needs to be considered. Although our study used an energy source of 60 W and 55℃, other studies have reported using energy sources of 60-100 W and 50-60℃ for similar research.19)20) Therefore, the difference in success rates could be a result of using different types of energy sources. Third, subject selection might play a role. In our study, patients with paroxysmal AF and chronic, persistent AF accounted for 74% (n=78) and 26% (n=27) of the studied population, respectively. Different numbers in the types of AF making up the selected patients may explain the differences in success rates.
Finally, the technical aspect may be a factor, as the results can vary depending on the training level of the procedure administrator.
Limitations
The limitations of this study are as follows; first, although PV stenosis can be detected easily by TTE, CT or MRI are the standard methods for predicting PV stenosis after PVI. Moreover, we did not perform postprocedure CT or MRI in all patients after PVI; thus we cannot determine the time course of PV stenosis development. Second, the endpoint of the study was unclear. The mean period for follow-up duration was 4.3±9.9 months in our study. A longer prognostic evaluation is necessary to prove not only the actual rate of PV stenosis, but also the safety and efficacy of antral ablation. Finally, the accuracy of the CARTOMERGE method needs to be considered. CARTOMERGE is a nonradioactive and global positioning system (GPS)-like method, and is superior in that it uses a mapping technology. But as the timing of MDCT imaging and the actual procedure differ, discrepancies in the length and volume of the left atrium may occur while integrating the images of the CARTO apparatus and MDCT.
Conclusion
Although PVI using high-frequency energy is definitely an effective curative procedure for patients with AF, it is associated with PV stenosis, a critical but rare complication. Our study indicates that PV stenosis can be detected easily by TTE, and that antral ablation can be safely performed with the electroanatomic CARTOMERGE mapping system to minimize the incidence of this complication. In all patients after PVI, long-term follow-up examination of PV patency by MRI or TTE is necessary.
 XML Download