

 PDF
PDF ePub
ePub Citation
 Print
Print


Introduction
The Tei index (also known as the myocardial performance index), has been reported to reflect both systolic and diastolic ventricular function.1-5) However, there are some concerns about the reliability of the Tei index since it cannot be calculated in a single cardiac cycle, particularly for the right ventricle (RV).6)7) Moreover, this shortcoming has seriously limited the application of the RV Tei index (RTX) in the presence of substantial heart rate fluctuations. Efforts have been made to overcome this limitation by using tissue Doppler echocardiography (TDE) to determine Tei indices,7)8) but the values measured by conventional flow Doppler (CFD) and TDE differ slightly.9) Recently, dual pulsed-wave Doppler (DPD) echocardiography was introduced, which allows flow velocities at different points to be measured using two independent sample volumes.
Using this technique, one can measure the parameters required to calculate RTX values in a single cardiac cycle (RTXDPD), which might overcome the limitations of CFD. Accordingly, we evaluated the feasibility and reliability of RTXDPD versus RTX by CFD (RTXCFD) and TDE (RTXTDE). In addition, we also investigated the clinical usefulness of RTXDPD by correlation analysis using invasively-measured RV pressures and exercise capacity.
Subjects and Methods
Study subjects
This study was approved by the Ethical Review Board of Samsung Medical Center in Seoul, Korea. Forty-one patients who underwent both right cardiac catheterization and echocardiography for RV volume or pressure overloading conditions, or for congenital heart diseases with cardiac shunts were evaluated. The study patients also underwent treadmill exercise testing with expired gas analysis. Patients meeting any of the following criteria were excluded: atrial fibrillation or hemodynamic instability, age <10 years, echocardiographic windows too poor for analysis purposes, and unwillingness to participate in the study. Fifteen healthy persons were also evaluated as the normal healthy control group for comparison of echocardiographic parameters, including RTX values.
Echocardiographic examinations
Comprehensive conventional two-dimensional (2-D) echocardiographic examinations were performed with an Accuvix XQ® cardiovascular ultrasound system (Medison, Seoul, Korea). The ultrasound examinations included measurements of the mid- and basal-transverse RV diameters, and the longitudinal diameter in an apical 4-chamber view, according to the recommendations of the American Society of Echocardiography.10) Left atrial volumes were calculated using the ellipsoidal method and indexed with respect to body surface area.11) The peak early diastolic mitral inflow velocity (E) and mitral annular velocity (E'MV) were measured in the apical 4-chamber view and the E/E'MV ratio was calculated.
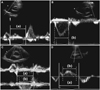
Annular velocities of the tricuspid valve (TV) were obtained in the apical 4-chamber views. The tricuspid annular velocities included the peak systolic TV annular velocity (S'TV), peak early diastolic velocity (E'TV), and late peak diastolic velocity (A'TV).12) Tricuspid inflows and pulmonary ejection flows were measured in the parasternal short axis view and used to determine the RTXCFD and RTXDPD values (Fig. 1A, B and C). The RTX was defined as the sum of the isovolumic contraction time (ICT) and relaxation time (IRT) divided by the pulmonary ejection time (PET), as follows: RTX=(ICT+IRT)/PET. To derive the sum of the ICT and IRT, the PET was subtracted from the time between the cessation to onset of tricuspid valve inflow.7)
To calculate the RTXTDE, the sum of the ICT and IRT was derived by subtracting the S'TV duration from the time interval between the end of the A'TV and the onset of the E'TV (Fig. 1D). Each of these parameters was measured using three consecutive beats and then averaged.
Right cardiac catheterization and cardiopulmonary exercise testing
Right cardiac catheterization was performed using a balloon-tipped pulmonary artery catheter in all patients. The RV systolic pressure (RVSP) was measured for three consecutive beats and then averaged. The study subjects were grouped according to the RVSP values using a cutoff value of 40 mmHg as follows: group A with a high RVSP (≥40 mmHg, n=18) and group B with a normal RVSP (<40 mmHg, n=23).
A symptom-limited exercise treadmill test with expired gas analysis was performed in all 41 study subjects. The peak O2 consumption rate (VO2 max) was measured at peak exercise. The VO2 max was indexed versus body weight and peak exercise capacity {metabolic equivalents (METs)} was calculated by dividing the measured VO2 max values by 3.5 mL/kg/min.
Statistical analysis
Statistical analysis was performed using SPSS 17.0 (SPSS Interactive Graphics, version 17.0; SPSS, Inc., Chicago, IL, USA). P<0.05 were considered statistically significant. Data are presented as the means±SD or as frequencies. Continuous variables were compared via one-way analysis of variance with post-hoc test using Bonferroni's correction method, and categorical data was analyzed using a Chi-squared or Fisher's exact test. Comparison between the mean values of the RTX measured using different methods was done with a paired t-test. The 2-tailed Pearson method was used to evaluate correlations between the RTX and other echocardiographic parameters.
In addition, stepwise multiple linear regression models were developed to predict exercise capacity. To investigate intra- and inter-personal measurement variability, measurements were performed off-line by two investigators on 20 randomly selected cases. The intraclass correlation coefficient of the RTXDPD for intra- and inter-observer measurements was 0.93 (n=20; p<0.001; 95% CI, 0.84-0.97) and 0.83 (n=20; p<0.001; 95% CI, 0.62-0.93).
Results
Baseline characteristics of the study population
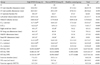
The baseline clinical characteristics and the diagnoses of the study subjects are shown in Table 1. The mean age of the 56 enrolled subjects was 34±12 years, and 21 subjects (38%) were males. In group A (i.e., a RVSP ≥40 mmHg), the mean RVSP was 70±30 mmHg, which was significantly greater than group B (28±4 mmHg, p<0.001). No significant differences in baseline characteristics were observed between these two groups, except for a slightly higher heart rate and lower systolic blood pressure in group B (p=0.073 and p=0.065, respectively). The clinical diagnoses in group B were mainly atrial septal defects (n=14, 61%) or patent ductus arteriosus (n=8, 35%). However, patients with idiopathic pulmonary arterial hypertension (n=4, 22%) as well as RV outflow tract obstruction (n=4, 22%) were also included in group A.
Echocardiographic data and cardiopulmonary function testing
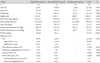
Echocardiographic data are presented by patient group in Table 2. No significant differences were observed between groups A and B in terms of cardiac chamber size or ejection fraction, although the mid-RV dimension measured in the apical 4-chamber view was significantly larger in group A (44±11 mm vs. 37±8 mm, p=0.028). In contrast, the S'TV and E'TV were significantly lower in group A (11.2±2.9 cm/sec and 10.1±3.9 cm/sec vs. 14.8±3.9 cm/sec, and 14.6±4.5 cm/sec, p=0.003 and p=0.001, respectively), whereas the RTXCFD and RTXDPD were significantly higher in group A (0.353±0.202 vs. 0.192±0.076, p<0.001, and 0.326±0.139 vs. 0.196±0.047, p<0.001). However, the RTXTDE values were not significantly different (p=0.160). Moreover, patients in group A had a shorter duration of exercise and a lower maximal exercise capacity (7.1±3.2 minutes vs. 10.2±1.4 minutes, p<0.001, and 6.3±2.4 METS vs. 9.6±1.7 METS, p<0.001, respectively).
Correlation analysis between the right ventricular Tei index and other parameters
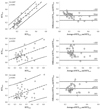
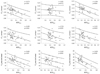
The mean RTXCFD (0.262±0.164) was similar to the mean RTXDPD (0.253±0.117, p=0.440), whereas the mean RTXTDE (0.447±0.125) was significantly higher than the mean RTXDPD (p<0.001) by paired t-tests. The RTXCFD and RTXDPD values agreed and correlated well with each other by Pearson's correlation analysis (r=0.90, p<0.001) and Altman and Bland curve analysis (Fig. 2). However, there was only a weak relationship between the RTXTDE and RTXDPD (r=0.48, p=0.001). While the RTXCFD and RTXDPD correlated moderately with the S'TV (r=0.57, p=0.001 and r=0.59, p=0.001), there was no correlation between the RTXTDE and S'TV (Fig. 3). Moreover, the RTXCFD and RTXDPD correlated well with maximal exercise capacity (r=0.62, p<0.001 and r=0.65, p<0.001), whereas the RTXTDE was only correlated weakly (r=0.45, p=0.004) (Fig. 3).
Multiple linear regression analysis and prediction of maximal exercise capacity
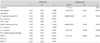
Multiple stepwise linear regression analyses were performed to identify those parameters that independently predicted maximal exercise capacity (Table 3). The mid-RV dimension, S'TV, E'TV, RVSP, and RTXDPD were related to maximal exercise capacity by simple linear regression analysis, and subsequent multiple linear regression analysis showed that male gender (β=0.45, p<0.001), LV ejection fraction (β=0.22, p=0.023), E'TV (β=0.30, p=0.003), mid-RV dimension (β=-0.26, p=0.012), and RTXDPD (β=-0.60, p<0.001) were independently related to maximal exercise capacity (adjusted R2=0.67). Based on a multiple regression model, including the RTXCFD and other independent variables, the RTXCFD was also independently related to maximal exercise capacity (β=-0.56, p<0.001, adjusted R2=0.64). However, based on multiple regression analysis including the RTXTDE as an independent variable, the RTXTDE was independently related to the exercise capacity, but the relationship was not as strong (β=-0.31, p=0.025, adjusted R2=0.45).
Discussion
The primary findings of this study were that the RTXDPD is correlated well with the RTXCFD, but not with the RTXTDE, in patients with a RV volume or pressure overloading condition, and the RTXDPD can be reliably measured during single cardiac cycles. Furthermore, the RTXDPD was an independent predictor of exercise capacity by multiple regression analysis.
RTXCFD determinations assume that each cardiac cycle has the same cardiac length, and thus these determinations are limited in patients with significant beat-to-beat variability or atrial fibrillation. Using the DPD method, we were able to obtain a flow signal at two independent sites simultaneously, and this method allowed precise determinations of ICT, IVT, and ET during single cardiac cycles. Thus, this method overcomes the limitation of the RTXCFD. In a previous study, the RTXTDE was shown to be reliable for evaluating RV function in pediatric patients.7) However, in the present study, the RTXDPD did not concur with the RTXTDE, although excellent concordance existed between the RTXDPD and RTXCFD. In a recent study performed in children, slight differences were found between the RTXTDE and RTXCFD, especially in larger and older children.9) Because the patients enrolled in this study were >10 years of age, our results support the opinion that the RTXTDE cannot substitute for the RTXCFD in these patients and age factors should be considered during the clinical use of the RTXTDE.
The finding that the RTXTDE was related to the E'TV, but not the S'TV, was interesting in that only the tricuspid annulus was used to determine the RTXTDE, which might partially explain why the RTXTDE values differed from the RTXCFD and RTXDPD values (Fig. 3). The RTXTDE was determined using tricuspid annular velocity tracing, which is associated with motion of the RV inlet. However, the structure and function of the RV inlet was primarily associated with RV diastolic properties. Additionally, in the RV the inflow and outflow tracts were separated unlike those in the left ventricle. Therefore, the fact that the RTXTDE, which is obtained only using the tricuspid annular velocity, is unrelated to RV systolic properties is understandable.
This is the first study to compare the RTXDPD with RTXCFD and maximal exercise capacity in patients with various RV loading conditions. In the present study, the RTXDPD was found to be related to the maximal exercise capacity of patients with a RV volume or pressure overload independent of age, gender, left ventricular ejection fraction, RVSP, and other RV echocardiographic parameters. This finding may be consistent with previous observations concerning the clinical usefulness of the RTX, and thus we are confident that the RTXDPD offers a feasible and useful means of evaluating the cardiac performance. Moreover, the excellent correlation between the RTXDPD and RTXCFD further supports the reliability of the RTXCFD, when measured in subjects with a regular cardiac rhythm. In addition, the DPD method could prove to be a useful clinical tool for measuring the time intervals, such as the ICT, IRT, or Tei indices, even in patients with atrial fibrillation, in which various parameters are non-determinable because of an irregular cardiac cycle.
Study limitation
The present study had several limitations that should be noted. The sample size was relatively small, and therefore the statistical power might be low. The RV pressure measurements were performed using fluid-filled catheters and not cathetertipped manometers, and we did not evaluate invasive RV parameters, such as dP/dt. However, the RV dP/dt increases paradoxically as the peak RV pressure increases until RV contractile dysfunction becomes evident, and therefore these derivatives of time-pressure curves might not represent RV function. The study group was heterogeneous as the patients enrolled for the RTXDPD analysis had various diseases. However, since RV function was shown to be one of the most important clinical predictors in the majority of study patients, the finding that RTXDPD independently predicts maximal exercise capacity supports its clinical usefulness in patients with RV volume or pressure overload. We used the RV dimension or E'TV as surrogate parameters of RV function instead of RV ejection fraction, which might be a gold standard of RV function if measured by a cardiac magnetic resonance imaging technique. The RTXDPD was not superior, but similar to the RTXCFD in terms of the correlation with the maximal exercise capacity. However, we measured the RTXDPD in the same cardiac cycle reliably and this method could make the RV Tei index potentially useful in the patients with an irregular heart rate, such as atrial fibrillation.
 XML Download