

 PDF
PDF ePub
ePub Citation
 Print
Print


Introduction
Current studies suggest that epicardial fat plays an important role in the development of coronary artery disease (CAD).1-6) Because epicardial fat directly surrounds the coronary arteries and may secrete numerous pro-inflammatory hormones and cytokines, and thus induces coronary endothelial dysfunction.7) To investigate the relationship between epicardial fat and CAD, it is important to measure epicardial fat accurately. In several studies, epicardial fat has been measured using various tools, such as magnetic resonance imaging (MRI),8) computed tomography (CT),1-3)6)9-13) and echocardiography.4)5) Several reports suggest that measurement of the epicardial fat volume using CT provides more objective results, as it is highly reproducible and requires less scanning time.1-3)6)9-13) However, the well-known, 2-dimensional (2D) short axis-based CT method is labor intensive and requires two steps.1-3)6)9-13) The first step involves manually tracing the area of the epicardial fat on each cross-sectional image. In the second step, the epicardial fat volume is determined as the sum of the epicardial fat area.
Recently, multidetector CT (MDCT) has allowed the acquisition of volumetric data sets during short scan times with easy 3-dimensional (3D) volumetric measurement. In the present study, we used a simpler method using surface-shaded display (SSD) for determining the epicardial fat volume. This technique permits the manipulation of the 3D epicardial fat volume in real-time using various tools, cutting the adjacent structures, and estimating the epicardial fat volume rapidly.14)15) A direct 3D epicardial fat volume measurement has not been published, thus the purpose of this study was to assess whether or not threshold-based 3D segmentation could replace the 2D short axis-based method for assessing the epicardial fat volume, and to evaluate the association between epicardial fat and CAD.
Subjects and Methods
Patient population
Between January and March 2008, we retrospectively included 100 consecutive patients (52 males and 48 females; mean age, 58.36±11.0 years) who had undergone coronary CT angiography. The patient population included the following diagnoses: atypical chest pain (n=46), angina pectoris (n=32), previous myocardial infarction (n=14), and high-risk CAD (n=71). We excluded patients with severe motion artifact during CT scan because the diagnostic accuracy of CAD was low.
We retrospectively reviewed the clinical information that exhibits cardiovascular and metabolic risk factors, such as hypertension, smoking, atypical chest pain, angina pectoris, and previous myocardial infarction. We obtained laboratory data, including serum triglycerides, total cholesterol, high density lipoprotein-cholesterol (HDL-C), low density lipoprotein-cholesterol (LDL-C), and elevated plasma glucose while fasting. All patients gave written informed consent, and our study protocol was approved by our local ethics committee. Also, we calculated the body mass index (BMI) as an indicator of patient obesity.
CT technique
Contrast-enhanced coronary CT angiography was quantified on retrospectively electrocardiography-gated cardiac CT scans using 64-slice MDCT (Lightspeed VCT; GE Healthcare, Milwaukee, WI, USA). The heart rates of the patients were measured 1 hour before the examination. If the heart rate exceeded 65 bpm, heart rate control was achieved with a beta-blocker {oral propranolol hydrochloride (Inderol), 40 mg/tablet}, except for patients in whom beta-blockers were contraindicated. Our coronary CT angiography protocol was applied as follows: slice collimation, 64×0.625 mm; gantry rotation time, 0.35 seconds; pitch, 0.2; scan time, 0.4 second; table feed, 6 mm/second; tube voltage, 120 kV; and tube current, 600 mAs.
At the time of scanning, patients received 80 mL of contrast agent (Iopromide, Ultravist 300; Schering, Berlin, Germany) at a rate of 5.0 mL/s for 16 seconds, followed by 50 mL of saline solution administered intravenously at a rate of 5.0 mL/s for 10 seconds. Injection was performed through an antecubital vein via an 18-gauge catheter. As soon as the attenuation in the ascending aorta reached the predefined threshold of 140 Hounsfield units (HUs), the scan was initiated. Data acquisition was performed in a cranial-caudal direction from the tracheal bifurcation to the diaphragm.
Epicardial fat measurement
All patient imaging data were transferred to a dedicated workstation (Advantage Windows 4.3; GE Healthcare, Milwaukee, WI, USA). Epicardial fat was defined as the adipose tissue between the myocardium from the surface of the heart to the visceral pericardium. Epicardial fat measurement was performed in the phase of the cardiac cycle with the least motion, which was most frequently the mid-diastolic phase (75% of the R-R interval). The two assessments, including the 2D short axis-based method and the threshold-based 3D segmentation were completed by one examiner blinded to any previous measurement of the epicardial fat volume. We calculated the time required for analysis by both methods.
Epicardial fat volume measurement using the 2-dimensional short axis-based method
The epicardial fat volume was determined using the 2D short axis-based method. This method is referred to as the 2D method. Reformatted images were obtained from the raw data of axial images to the 2D short axis views with 3-mm slice thickness and 3-mm intersection gaps. The stacks of the short axis views began at the diaphragm and extended to the pulmonary valve.
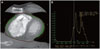
The pericardium was manually traced and a region of interest defined by the histogram-based statistical program was placed (Fig. 1A). A CT attenuation threshold between -200 and -30 HU was used to isolate the epicardial fat (Fig. 1B). Finally, the epicardial fat volume was obtained by multiplication with the section thickness.
Epicardial fat volume measurement using threshold-based 3-dimensional segmentation
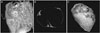
We reconstructed the epicardial fat volume using threshold-based 3D segmentation. This method is referred to as the 3D method. Image segmentation was based on the same threshold range as mentioned in the known method, which meant that all pixels other than this value were automatically removed. The epicardial fat volume in the 3D method was defined as that located from the level of the pulmonary trunk to the diaphragm. The initial 3D volumetric data obtained was not only intrathoracic fat, but other fat tissue, such as fat surrounding the pulmonary vein and airway structure and fat within the chest wall (Fig. 2A). The 3D epicardial fat volume in the workstation was manipulated using tools, such as zoom, pan, and rotation, around any axis and the adjacent structures were cut.15) Also, the epicardial fat was referred to the axial slice and subtracted from the fat outside of the visceral pericardium (Fig. 2B). Finally, the 3D epicardial fat volume was determined and the epicardial fat volume was automatically measured (Fig. 2C).
Coronary artery disease assessment
Among the CT data sets of all 10 reconstruction intervals, the best reconstruction interval containing the fewest motion artifacts was selected for further evaluation. Measurements were performed using the same workstation programs. First, the presence of coronary artery stenosis was determined on the axial images, thin-slab, maximum intensity projections, and the curved multiplanar reformatted images. Next, semiquantitative assessment of the stenosis was based on the ratio of the minimal contrast lumen over the normal reference lumen of an unaffected distal lumen. The CAD group was defined as stenosis >50% of the luminal area. The control group was defined as non-CAD and stenosis <50% of the luminal area.
Two cardiac radiologists interpreted the images in consensus. The two radiologists who evaluated the CAD were blinded to the epicardial fat volume. The mean heart rate during the MDCT was 64±9 bpm (range, 52-74 bpm).
Statistical analysis
Statistical Package for the Social Sciences (SPSS), version 12.0 (SPSS Inc., Chicago, IL, USA) was used for the statistical analyses. The values were expressed as the mean±standard deviation (SD) or number (percentage). For dichotomous variables, the proportions were compared using chi-square analysis. For continuous variables, the mean and SD were compared using Student's unpaired t-test. To adjust the mean epicardial fat volume for BMI differences, we used analysis of covariance (ANCOVA, general linear model). We used Pearson's correlation analysis for analysis of the comparison of two measurement methods and the relationship between the epicardial fat volume and metabolic syndrome. A p<0.05 was considered to indicate significance in all analyses.
Results
Clinical characteristics
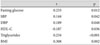
Our study group consisted of 100 patients (age, 18-81 years; 52 males and 48 females). The patients were divided into the following groups: CAD group (n=60); and control group (n=40). Table 1 showed the clinical and laboratory data of the CAD and control groups. Smoking, angina pectoris, fasting plasma glucose, total cholesterol, LDL-C, and triglycerides were among the risk factors that were significantly higher in the CAD patients.
Comparison of epicardial fat volume measured with two methods
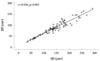
There was a strong correlation between the two methods for quantifying the epicardial fat volume (r=0.956, p<0.001) (Fig. 3). The correlation between the two methods did not differ significantly between the control and CAD groups (r=0.966 and r=0.948, respectively). The mean epicardial fat volume by the 3D method was significantly larger by the 2D method (89.04±35.11 cm3 vs. 142.37±55.60 cm3, p<0.001) because the measurement extent was different in the two methods. The mean overestimation of the epicardial fat volume was 59.89±12.00% by the new 3D method. The mean time required for analysis was significantly higher in the 2D method (26.3±8.3 minutes vs. 4.9±1.2 minutes, p<0.001).
Relationship of the epicardial fat volume and the presence of coronary artery disease
The epicardial fat volume was significantly higher in the CAD group than the control group (3D method: 165.07±48.22 cm3 vs. 108.39±48.03 cm3, p<0.001; 2D method: 103.23±32.17 cm3 vs. 68.52±28.70 cm3, p<0.001). After adjustment for the BMI using ANCOVA, the CAD group had a significantly higher epicardial fat volume than the control group (p<0.001).
Relationship between the epicardial fat volume and various parameters of metabolic syndrome
Table 2 represents the correlation of the epicardial fat volume and various parameters of metabolic syndrome. The epicardial fat volume by the 3D method was significantly correlated with the fasting plasma glucose (r=0.233), systolic blood pressure (r=0.144), diastolic blood pressure (r=0.189), HDL-C (r=-0.187), triglycerides (r=0.234), and BMI (r=0.308).
Discussion
In the present study, we assessed a simple estimation technique using threshold-based 3D segmentation for determining the epicardial fat volume. Although this technique has been used to subtract the left ventricle and lung in previous studies,14)16) no study has been performed to subtract the epicardial fat. There are differences in the attenuation between epicardial fat and other structures surrounding that the epicardial fat. Our study compared two different methods for quantifying epicardial fat volume. The existing method is a 2D short axis-based method, and the new method is a 3D segmentation method based on automated threshold-based analysis.
In previous studies, epicardial fat measurement on CT used the 2D short axis-based method.1-3)6)9-13) A limitation of this method was the semi-automatic tracing of the pericardium in every slice section, taking a long time for post-processing. The duration of post-processing in the 2D method was 26.3±8.3 minutes in our study. Another limitation was that the absolute epicardial fat volume can be different because previous reports used various slice thicknesses and intersection gaps.1-3)6)9-13) The thick slice thickness induces a partial volume effect, thus the epicardial fat volume can be estimated inaccurately.
According to the development of a computer software programs, the threshold-based 3D segmentation algorithm suface shaded display is possible for assessing the epicardial fat volume. This algorithm consists of three steps.14) The first step is the imaging itself.14) The second step involves the fat region extracted from the CT images by gray-level thresholding.14) The fat has a relatively low CT attenuation number compared to other soft tissue structures and bone. We labeled pixels in the epicardial fat with CT numbers between -200 and -30 HUs. The third step is the shading procedure and 3D reconstruction.14) In the thorax, the CT number alone was not sufficient to distinguish the epicardial fat from the other surrounding tissues. The intrathoracic fat, including epicardial fat, has the same density in CT images, and the pericardium within the intrathoracic fat is not always well-defined in the 3D image. Thus, we compared the intrathoracic fat with the corresponding axial, coronal, and sagittal images and subtracted the fat outside of the visceral pericardium effectively. When the epicardial fat volume was measured using the 3D method, it took a long time, but gradually took less time (mean time, 4.9±1.2 minutes). Also, this technique required minimal computing power, was easy to perform, and did not affect the slice thicknesses or intersection gaps because we obtained the 3D epicardial fat volume based on a raw data of 0.625 mm thickness. Thus, we can obtain more objective results with the 3D method compared to 2D method.
The epicardial fat volumes measured using the two methods were highly correlated, although the absolute amount of the epicardial fat volume differed between the two methods because of the differences in the extent of estimation. We determined the right pulmonary artery and the pulmonary valve as cut-off points in the 3D and 2D methods. In the 3D method, we could not determine the exact location of the pulmonary valve level, so we defined the right pulmonary artery as cut-off point. We found a considerably higher epicardial fat volume using the 3D method (approximately 1.6-fold). This result indicates that the new threshold-based 3D segmentation using SSD may be expected to be another good method replacing the previous 2D short-axis-based method, even with the difference in extent for measuring the epicardial fat. We used the retrospectively contrast-enhanced coronary CT angiography for measuring the epicardial fat, but another report used non-contrast CT images acquired for routine coronary calcium screening.9) More comparative studies will be needed to determine the most accurate and feasible method for measuring epicardial fat.
We also demonstrated a relationship between epicardial fat and CAD. The recent studies have shown that abdominal visceral fat is an important risk factor for CAD.6)17)18) As epicardial fat is a true visceral fat that becomes deposited around the heart, it may contribute to the progression of coronary atherosclerosis.1-6) The previous reports demonstrate that the amount of epicardial fat is associated with CAD alone, and CAD and metabolic risk factors.1-6)10)13) Our results showed that the epicardial fat volume was significantly higher in the CAD group than in the control group. A similar result was obtained after adjustment for BMI in our study. Also, the epicardial fat volume was significantly correlated with risk factors of CAD and metabolic syndrome.
Some limitations of this study were as follows. First, our study population was pre-selected as we excluded patients who had undergone coronary stent or bypass surgery. Therefore, patients with known CAD were excluded from our study. Because the stent itself has a thrombogenic effect, we thought that it would be affected by the accumulation of epicardial fat.19) The epicardial fat can be removed and damaged during coronary artery bypass surgery.20) Second, as mentioned above, the threshold-based 3D segmentation algorithm has a potential limitation. In the thorax, the CT number alone was not sufficient to distinguish the epicardial fat from surrounding tissues. Because intrathoracic fat, including epicardial fat, has the same densities in CT images, the pericardium within the intrathoracic fat is not always well-defined in the 3D image. Comparison with the corresponding axial image allowed the effective subtraction of the fat outside of the visceral pericardium. This additional step needed more time by the 3D method, although it took less time compared to the 2D method. Third, we did not use the same extent for measuring the epicardial fat volume to compare the two methods. Thus, a direct comparison between the two methods was not possible in this study. Fourth, no standardized criterion was established to quantify the epicardial fat volume because previous reports used various extents and density ranges. A consensus and a large amount of clinical data will be necessary for quantifying the epicardial fat volume.
In summary, threshold-based 3D segmentation using the SSD technique is a feasible, convenient, and powerful tool to measure epicardial fat volume related to CAD.

 XML Download