

 PDF
PDF ePub
ePub Citation
 Print
Print


Introduction
Right ventricular infarctions are concurrently present in approximately 50% of patients with inferior wall myocardial infarctions.1) Although inferior wall myocardial infarctions have a good clinical course as compared with anterior wall myocardial infarctions, the mortality is increased due to the decreased cardiac output and arrhythmias in cases in which a right ventricular infarction is concurrently present. An early diagnosis of the concurrent presence of a right ventricular infarction during a medical evaluation would be clinically essential.2-5) Thus, many physicians have checked right-sided precordial leads (V3R and V4R leads) of patients with inferior myocardial infarctions to rule out right ventricular infarctions.6-8) However, the electrocardiogram (ECG) patterns from the right precordial leads in normal adults have not been thoroughly investigated. Specifically, it would be of enormous significance in diagnosing right ventricular infarction to examine whether ST segment elevation (STE) would also be present on the right precordial lead when it is typically detected on the left cordial lead in normal healthy adults. Further, it would be of clinical value to confirm whether Q wave and T wave inversion, indicating coronary artery disease on a normal conventional 12-lead ECG, would also have the same significance on the right precordial lead.
We were particularly interested in confirming whether the normal ECG findings of the right precordial lead, STE, the presence of a Q-wave, and T-wave inversion are normally observed in healthy people. Thus, we conducted this study to determine the prevalence of STE and to analyze the right-sided precordial leads (V3R and V4R leads) in normal adult Koreans.
Subjects and Methods
One hundred forty-five healthy male volunteers who registered at the Armed Forces Daejeon Hospital for military recruitment were enrolled between December 2006 and April 2007.
Excluding 15 subjects who were diagnosed with hypertension or those who had abnormal findings, such as cardiac enlargement detected on chest radiography, for which a meticulous physical examination was performed, 130 healthy volunteers were screened and then analyzed by an ECG. In these subjects, the chest circumference was measured and an ECG was performed. For an ECG in a stabilized condition, a right precordial lead ECG as well as a normal conventional 12-lead ECG was performed. The results were analyzed by one specialist in emergency medicine and then reviewed by one physician. The ECG equipment used herein included a HP pagewriter 200 (Hewlett-Packard, Palo Alto, CA, USA), on which recordings were done at a velocity of 25 mm/sec and a voltage of 1 mV=10 mm. The location of an electric pole for the right precordial lead was the space between V1 and V4R for V3R, the median line of right clavicle in the fifth right intercostal space for V4R, the right anterior axillary line which was parallel to V4R for V5R, and the right middle axillary line which was parallel to V4R for V6R. All of the patients laid on the table and were stabilized for >5 minutes before the ECG was performed. The ECG findings were interpreted using a caliper, for which the form of the QRS wave and the size of the Q-, R-, and S-waves were measured. The shape and size of the T-wave were measured. The height of the ST-segment was measured from the point in time in which 0.04 seconds elapsed from the J point. The degree of elevation from the baseline, the TP-segment, was then measured. Cases in which the height of the ST-segment from the baseline, the TP-segment, exceeded 1 mm on the left cordial lead and 0.5 mm on the limb lead and right precordial lead were defined as 'STE'.9)10) Based on these definitions, the shape and size of the QRS-wave, the degree of STE, and the shape and size of the T-wave on the V3R and V4R leads, both of which were right precordial leads, were analyzed. The factors that might be associated with the degree of STE on the V4R lead, which is essential for a diagnosis of right ventricular infarction, were also examined. Thus, the relatedness to STE was assessed. Cases in which the degree of STE was shown to exceed 0.5 mm on the V4R lead were assigned to group A and the other cases were assigned to group B. Then, a comparison of the results was made between the two groups.
Results
General characteristics
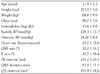
In volunteers, the mean values of age, height, weight, chest circumference, and systolic and diastolic pressures, which were measured on ECG, and heart rate are represented in Table 1. There were 32 cases (24.6%) in which bradycardia was detected (at a frequency of 60 times/min on ECG) and 1 case (0.8%) in which tachycardia was detected (at a frequency of 100 times/min). Most cases had a sinus rhythm, but 8 cases (6.2%) had a sinus arrhythmia. On the QRS axis, there were 5 cases (3.9%) in which the degree of left axis deviation exceeded -30° and 18 cases (13.8%) in which the degree of right axis deviation exceeded +90°. The remaining 107 cases (82.3%) had a normal axis. There were no cases in which a grade 1 atrio-ventricular (AV) block, defined as a prolongation of PR interval >200 ms, was present. There were 4 cases (3.1%) in which an extensive QRS wave >120 ms was present. There was 1 case in which a long QTc interval of >460 ms was present.
The shape of QRS wave on the right precordial lead
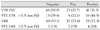
The typical shape of the QRS wave seen in the right precordial lead is shown in Table 2. On the V3R lead, the proportion of rS and rs type was 41.5% and 39.2%, respectively, accounting for most cases. This was followed by the Rs or RS type, the proportion of which was 10%. On the V4R lead, most cases had a rs type and the proportion was 60%. This was followed by rS (14.6%) and rsr' (10.8%). There was 1 case in which a q wave was observed on the V3R lead, but 6 cases (4.6%) on the V4R lead. The size of the r wave was 2.39±1.51 mm on the V3R lead and 1.81±1.19 mm on the V4R lead. The size of the S wave was 5.14±3.27 mm on the V3R lead and 2.55±2.09 mm on the V4R lead (Table 3).
Changes in the ST segment on the right precordial lead
The mean height of the ST segment on the V3R lead was 0.19±0.30 mm, and there were 33 cases (25.4%) in which STE was observed. The mean value of the STE was 0.62±0.24 mm. The mean height of the ST-segment on the V4R lead was 0.42±0.16 mm, and there were 8 cases (6.2%) in which STE was observed. The mean value of STE was 0.63±0.23 mm. Of 8 cases in which the ST segment was elevated on the V4R lead, 5 had a flat type of STE and the remaining 3 had an up-slope type. In cases in which there was STE, the shape of the QRS wave is shown in Table 4.
The shape of the T-wave on the right precordial lead
The shape of the T-wave, which can be seen most commonly on the right precordial lead, was a negative shape. The T-wave was seen in 50.8% of the V3R leads and 53.1% of the V4R leads. In cases in which the degree of STE exceeded 0.5 mm, the shape of the T-wave that was concurrently present at a higher frequency was a positive shape. This accounted for 48.5% of the V3R leads and 50.0% of the V4R leads (Table 5).
Relationship with the normal conventional 12-lead electrocardiogram
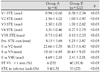
A regression analysis was performed for STE present on the V4R lead, and this showed that the degree of STE seen on leads II, III, aVF, V1, V3, V6, and V3R had a significant correlation with the size of the S-wave on the leads V2, V3R, and V4R (Table 6). The difference between group A, in which the degree of STE exceeded 0.5 mm on the V4R lead, and group B, in which no STE was observed, was significant (Table 7).
Discussion
In 1974, Cohn et al.10) first reported the importance of right ventricular infarction. Since then, several studies have reported the ECG findings of right ventricular infarctions, appearing as a diagnostic clue on the right precordial lead, which were concurrently present in patients with acute left ventricular wall myocardial infarction. Of these, the STE on the V4R lead is known as the most reliable diagnostic indicator for right ventricular infarction. To date, however, little data regarding normal ECG findings on the right precordial lead have been reported. In Korea, the studies which have been conducted to examine the relationship between the normal ECG findings on the right precordial lead and the STE on the right precordial lead have been inadequate.
In the current study, the most common form of QRS wave that was observed on the V3R lead was rS and the frequency corresponded to 41.5%; this was followed by rs (39.2%) and rsr' (8.5%). These results were discrepant (81.0% and 89.0%, as reported by Tan et al.11) and Saito et al.12)). This discrepancy was attributed to the rS type subdivided into rs, rS, Rs, and RS types in the current study, unlike the studies by Tan et al.11) and Saito et al.12) If the sub-type classification was combined as the rS type, the total frequency would have been 90.7%. This frequency is similar to the extant literature. The shape of the QRS wave on the V4R lead also showed that the rs type occurred in 60.0% and this type accounted for most of the cases; this was followed by rS (14.6%) and rsr' (10.8%). If the sub-type classification was combined as the rS type, the total frequency would have been 73%; this frequency is similar to the extant literature.
There was only one case of a qs wave in which the q wave was observed on the V3R lead. On the V4R lead, however, there were three cases of qr. There were two cases of qs and there was one case of qrs. There were six cases (4.6%) of a q wave, which was prevalent on the V4R lead as compared with the V3R lead. These results were similar to the 4% prevalence reported by Tan et al.11) This suggests that the q wave could also occur on the V4R lead. Even in cases in which the q wave could be observed, however, there was no concurrent presence of the STE. Thus, there were no cases in which STE was concurrently present with the q wave on the normal V4R lead. These findings could be helpful for interpreting the q wave, which was observed on the V4R lead, and thereby making a diagnosis of right ventricular infarction.
The size of the R wave was 2.39±1.51 mm on the V3R lead and 1.81±1.19 mm on the V4R lead, which was smaller than that noted on the left cordial lead. The size of the S wave was also shown as 5.14±3.27 mm and 2.55±2.09 mm in the corresponding order, which was smaller than that seen on the left cordial lead. These measurements were similar to those which have been proposed in other studies. With the progression of the V3R to the V4R lead, the size of the R and S waves was decreased and the ratio of R/S was increased. The proportion of cases in which the R/S ratio exceeded 1 was also increased. These findings were also in agreement with other studies.
STE was 25.4% on the V3R lead and 6.2% on the V4R lead. These results confirmed that the STE could be present normally on the right precordial lead. These results showed no significant discrepancy from 16% and 3%, which was proposed by Saito et al.12) 13% and 5% which was proposed by Tan et al.11) and 23% which was proposed by Feola et al.13) But there were no cases in which the ST-segment was elevated by >1 mm on the V3R and V4R leads.
With respect to the shape of the T-wave on the right precordial lead, other studies have reported that T-wave inversion was commonly observed at a frequency of approximately 50-60%. According to Korean reports of Gill et al.14) T-wave inversion occurred at a frequency of 48% on the V3R lead and 46% on the V4R lead. Also in our series, the proportion of cases in which the T-wave had a negative shape was 50.8% on the V3R lead and 53.1% on the V4R lead. These results confirmed that T-wave inversion could also be found commonly on the right precordial lead. In cases in which STE was observed on the right precordial lead, the shape of the QRS and T-wave was evaluated. According to this, the shape of the QRS wave showed that the rS type was the most prevalent on both the V3R and V4R leads, as shown in cases in which there was a lack of STE. But the shape of the T wave had a flat or an up-slope form (V3R, 68.5%; V4R, 77.3%) in most cases in which there was a lack of STE. The positive cases were most prevalent (V3R, 48.5%; V4R, 50.0%).
In the current study, we confirmed the factors that are associated with the degree of STE on the V4R lead, which is most important for making a diagnosis of right ventricular infarction. STE seen on the V4R lead had the highest degree of correlation with the degree of STE seen on the V3R lead (r=0.544). It also had a correlation with the degree of STE seen on the inferior leads (II, III, and aVF; r=0.347, 0.312, and 0.356, respectively). On the right lead (V1) it also had a correlation with the degree of STE (r=0.324). On the left cordial lead, however, there was no correlation with the degree of STE. The degree of STE on the V4R lead had a correlation with STE on the right precordial lead and the inferior lead. But it was found to have no correlation with STE on the left cordial lead.
Between group A in which the degree of STE exceeded 0.5 mm on the V4R lead and group B in which it was not shown, there were no significant differences in baseline characteristics. The mean value of STE seen on leads V1-4 was significantly greater in group A than group B. The size of the S wave was also significantly greater in group A than group B. On the cordial lead, criteria for STE which are applied to a clinical setting, however, when it was examined whether STE ≥1 mm and STE ≥0.5 mm on the limb lead were present, only the STE seen on V1 lead and the inferior lead had a higher profile of the degree in group A than group B.
In conclusion, STE ≥0.5 mm and T-wave inversion were the findings that could be observed at a relatively higher frequency on the right precordial lead in normal healthy adults. It was also shown that the q wave was normally present. But there were no cases in which there was a STE ≥1 mm and STE was present concurrently with a q wave. In determining the concurrent presence of right ventricular infarction, these findings must be considered.
Limitations of the current study
In the current study, attempts were made to propose the ECG findings on the right precordial lead in normal healthy adults who underwent a physical examination for conscription from a nationwide perspective. Based on the characteristics of a physical examination for conscription, however, it was inevitable that male subjects aged early to middle twenties were included in the current analysis. According to a study which was conducted by Feola et al.13) a comparison of the ECG findings seen on the right precordial lead was made between the younger subjects and the older subjects and this showed that there was no significant difference in the pattern of STE. Results of the current study could not be generalized, however, because an analysis was performed for male subjects with a specific age group.


 XML Download