

 PDF
PDF ePub
ePub Citation
 Print
Print


Introduction
A survey of the prevalence of obesity among children and adolescents conducted in Korea in 2005, reported that 9.7% of subjects were obese; prevalence rose to 19.0% when overweight children were included.1) Although the rate in Korea was lower than the 17.1% rate for the prevalence of obese children and adolescents in the U.S. examined between 2003 and 2004, there was a tendency towards an increase in both countries.2)3)
Obesity in childhood leads to various problems in adulthood including cardiovascular diseases such as hypertension, and their death rate is high.4-8) In addition, the blood pressure (BP) of children was reported to increase with a higher body mass index (BMI),9) so the management of obesity in childhood is a critical factor for the management of BP in adults.
Manual measurements of BP have been used previously, but they have the disadvantage of not checking the BP continuously. Ambulatory blood pressure monitoring (ABPM) allows the acquisition of more accurate and more physiological results by considering daily changes; and its usage for childhood obesity has been reported.10-12) However, standards have not been established, so medical staffs hesitate to use it.13)
Accordingly, our study used 24 hour ABPM to investigate differences in BP between obese and normal children and adolescents. In particular, we tried to determine characteristics of BP load, one of the key contributing factors to ABPM, the meaning of which in children and adolescents is not clear.
Subjects and Methods
We recruited 60 children who had visited the department of pediatrics of Sunlin hospital, Pohang between 1 January and 31 August, 2008 and underwent ABPM.
Subjects were divided into three groups according to their BMI. Based on the BMI distribution of Korean children as documented by the Korean Pediatric Society and Korea Centers for Disease Control and Prevention in 2007,14) BMIs of the obese, overweight and normal groups were, respectively, 95th percentile, 85th to 95th percentile, and less than 85th percentile.
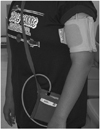
ABPM was performed with BP one (ET-med, Vignate, Italy) and BP was measured automatically by using an oscillometric method every 15 minutes during the daytime and every 30 minutes at night. Daytime and nighttime was determined individually for each subject by considering their daily life, so a different nighttime was used for each patient. The cuff was set on the left brachium of the subjects and covered 2/3 of the brachial length (Fig. 1). When, in a few cases, the cuff was different than the brachium of a child, one level higher cuff was then used, and such cuffs were not >50% of the brachial length.
Hypertension was diagnosed when the average overall systolic or diastolic pressure from ABPM was > the 95th percentile of the normal BP of Korean children as established in 2007.15) BP load for daytime and nighttime were calculated as a percentage of the frequency with which it exceeded the upper level of the normal range during each time bin to the total frequency during measurement of BP for the same time. Although this study used standard BP values without adjusting for daytime, an adjustment of reducing by 10% of the standard was used for the nighttime with considering a normal decrease of BP while sleeping. To evaluate confidence of the examination, a successful measurement rate was calculated with a percentage of the frequency of succeeding in measuring BP.
Moreover, all subjects participating in this study underwent cardiac ultrasonography as well as an examination for the degree of obesity. Based on such results, cases that appeared to have secondary hypertension, such as renovascular hypertension or hypertension related to coarctation of aorta, were excluded.
For statistical analysis we used one way analysis of variance (ANOVA), the chi-square test and the Mann-Whitney test. All tests were performed using Statistical Package for Social Science (SPSS) 11.5 and a p less than 0.05, was considered to be significant.
Results
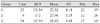
The age and the BMI of the total group of subjects were 13.47±2.99 years (7-18 years) and 23.5±5.3 kg/m2 (17-39 kg/m2) respectively (Table 1); the mean successful measurement rate was 76.3% (42-100%).
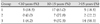
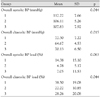
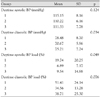
Subjects were divided into an obese group (27 children, male/female:3/14), an overweight group (9 children, male/female:7/2) and a normal group (24 children, male/female:14/10) (Table 1); their average ages were, respectively, 12.33±3.13, 13.44±1.74 and 14.75±2.75 years. When the ages of subjects were classified into three groups (less than 10 years; 10 to 15; and more than 15 years), the three groups showed a statistically significant difference (p=0.014) in age distribution. In the obese and overweight groups, the number of subjects aged 10 to 15 years was highest (63.0%, 77.8%); in the normal group, subjects over 15 years of age accounted for the largest part of the group (58.3%) (Table 2). The overall systolic pressure values of the three groups were, respectively, 112.22±7.66 mmHg, 106.11±5.26 mmHg and 107.83±7.92 mmHg; diastolic pressures were 72.30±7.22 mmHg, 64.67±4.53 mmHg and 70.13±6.50 mmHg (Table 3). There was a significant difference between the three groups in systolic (p=0.044) and diastolic (p=0.015) pressures. However, when the overweight group, which had a small number of subjects, was excluded, the difference between the obese group and the normal group was significant only for average systolic pressure (p<0.05). The average systolic pressures during the daytime were 115.15±8.16 mmHg, 110.22±6.16 mmHg and 111.33±7.78 mmHg, respectively; the diastolic pressures during the daytime were 78.48±8.70 mmHg, 70.67±5.96 mmHg and 75.21±7.24 mmHg (Table 4). Although diastolic pressures showed a significant difference among the three groups (p=0.034), it was not significantly different between obese and normal groups.
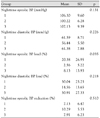
Last, systolic pressures during the nighttime were 106.30±9.60 mmHg, 100.22±6.28 mmHg and 102.13±9.39 mmHg, respectively; diastolic pressures during the night were 61.59±8.71 mmHg, 56.44±5.50 mmHg and 61.38±7.88 mmHg, respectively, in the obese, overweight and normal groups. There was no significant difference among the three groups. The decrease in systolic pressure during the nighttime also did not show a significant difference among the three groups:values were 7.13±6.47%, 10.29±5.53% and 7.91±6.23% in the obese, overweight and normal groups, respectively (p=0.510) (Table 5).
For overall BP load of the three groups, the obese, overweight and normal groups showed values of 14.38±15.10%, 4.78±5.17% and 7.05±11.53%, respectively. For systolic pressure, there was no significant difference among the three groups (p=0.063) (Table 3). However, when systolic and diastolic BP loads were examined by dividing into the daytime and the nighttime, a significant difference was observed:the systolic BP loads during the daytime were, respectively, 19.74±20.25%, 6.89±7.17% and 9.54±14.98% (p=0.049) and the systolic BP loads during the nighttime were 20.38±26.95%, 2.56±5.22% and 8.13±13.93% (p=0.035) (Table 4 and 5). In addition, when the systolic BP loads of the obese group and the normal group were compared by excluding the overweight group, p for daytime and nighttime were 0.045 and 0.042, respectively, which meant that the obese group had a significantly higher BP load than the normal group.
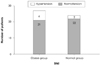
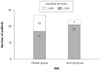
But, this result came from a comparison between BP and BP load, and an examination of overall BPs showed that 6 (22.2%), 0 (0%) and 2 (8.3%) children were considered to have hypertension in the obese, overweight and normal groups, respectively. There was no significant difference between the obese group and the normal group (p=0.173) (Fig. 2). In the meantime, when the BP load for systolic pressure during the daytime was investigated, subjects with over a 25% increase in BP load included 10 (37.0%), 0 (0%) and 3 (12.5%) children in the obese, the overweight and the normal groups, respectively; and a comparison between the normal group and the obese group showed a significant difference (p=0.045) (Fig. 3). However, patients with a BP load that was 25% greater during the nighttime included 7 and 4 patients in the obese group and the normal group, respectively, and the difference was not significant (p=0.425).
As a result, the obese group showed a significantly higher level compared to the normal group only for overall systolic pressure. BP load of the obese group was significantly higher in both daytime and nighttime. In addition, when standards for hypertension were used, no significant difference in the number of hypertension patients was observed in the obese group and the normal group. When a systolic BP load over 25% was utilized as a meaningful standard, the obese group was found to have significantly more such patients than the normal group.
Discussion
Twenty four hour ABPM is generally considered to be better than common BP measurements for cases of suspected white coat hypertension, hypertension not responding to drugs, and orthostatic hypotension,10)16)17) but its meaning for children has not been clearly determined. One of the reasons for that is the difficulty in diagnosis of hypertension for children because their normal values are not confirmed and diagnostic standards are not established.
The prevalence of hypertension in children and adolescents has been reported to be 2-5%.18)19) Although children are known to experience secondary hypertension more, their rates of essential hypertension, which appear to be related to a current increase in obesity, becomes a serious issue. In addition, while an ordinary BP measurement of an obese child may be normal, ABPM can detect hypertension in some of these cases, and such cases are said to constitute masked hypertension. Masked hypertension is reported with a considerable frequency (7.5%) in children and adolescents.20) That rate is considered to be closely related to damage to a target organ.20-22) Therefore, the use of 24-hour ABPM should increase, and studies on it should be actively conducted in the future.
One of the most difficult issues in this study was to settle on standards of BP. Although a standard table for growth and BP of children and adolescents was reported in Korea in 2007,15) it measured ordinary BP, so comparing it with BP measured with 24-hour ABPM could lead to an excessive rate of diagnosis as Diaz et al.23) said. In addition, a study examined BP of 1,141 normal children and adolescents with ABPM24); but it is hard used this as an appropriate standard for Korean children and adolescents because it was reported in 1997 and the race of the subjects was not Korean. Therefore, the current authors thought that using normal ranges reported in Korea was better even though they were ordinary BPs. By considering the decrease in BP while sleeping, a range for nighttime pressures was created by reducing the reported range by 10%.23) Although these standards can not be an absolute definition for diagnosis, even arbitrary standards were thought to be useful investigating difference in BP between obese and normal groups and to determine the meaning of a specific index of ABPM by applying it to both of the two groups. However, the normal ranges of BPs according to age and gender for Korean children and adolescents should be studied and established soon.
Like previous investigations, this study also found that overall systolic pressure was higher in the obese group than in the normal group.11) But, while the previous study measured ordinary BP first and then, if necessary, gauged ABPM, our study performed ABPM in all risk groups without measuring ordinary BP (we did this to detect masked hypertension observed in obese children and adolescents).
Compared to average BP, BP load means the percentage of the frequency of measured BPs meeting the standard for hypertension, and it was a characteristic index of ABPM. Although its meaning was not determined specifically, in adults with hypertension it was reported to be more closely related to cardiac function or left ventricular hypertrophy than to average BP.25-27) However, there has been no accurate standards for children established, and only some researchers suggested BP load over 25%, 35% and 50% as the cutoff value.23) Our study conducted analyses using 25%28) because it is the minimal level showing a difference to increase sensitivity with the standard for BP load. That was also done because the authors observed that a lower frequency led to the disappearance of a statistical difference between the obese group and the normal group when the standard of abnormality of BP load was 35%.
The authors decided to analyze BPs for daytime and nighttime separately to produce more accurate results, and we used a 10% decrease in BP as a standard for the nighttime. As expected, the obese group showed an absolutely higher average BP and higher BP load. However, statistical significance was found to be more robust for BP load. Although there were no accurate standards for diagnosis of hypertension, the number of patients considered to have hypertension using average BPs in the obese group was not significantly different with that in the normal group, and the number of patients with over 25% of systolic BP load in the daytime was significantly higher in the obese group than in the normal group. This result suggested that BP load should be considered in diagnosis of hypertension through ABPM. In addition, the decreased BP during the nighttime observed frequently in ABPM was usually examined with systolic pressure. Although a decrease of over 10% was considered to be normal, standards and explanation for children were not determined yet. Our study found that there was no significant difference among the three groups and patients with less than 10% of the decrease were observed even in the normal group. So, we did not analyze it in more detail. Last, one of the critical factors for ABPM is confidence in the test. As important factors, a method measuring BP and the choice of equipment should be considered. This study excluded one case with around 20% of the successful measurement rate.
One of the most serious limitations of this study is that it could not use any absolute standard for diagnosis of hypertension. The results measured in this study were less representative of because it did not compare and analyze data for many subjects. Actually, obese children increased but evaluation of their risk of hypertension was hard to do. Therefore, more active evaluation and management were thought to be necessary. The authors will examine development of essential hypertension of the subjects in a future study based on the results of this study through follow-up, and they will look for significant difference among subjects with different types of damage to target organs by supplementing this study more.
 XML Download