

 PDF
PDF ePub
ePub Citation
 Print
Print


Introduction
Right ventricular (RV) dysfunction is a frequent consequence of severe pulmonary embolism (PE), and correlates with a poor prognosis and high mortality rates.1-5) Therefore, the detection of right ventricular dysfunction (RVD) is important for deciding on the optimal management strategy for patients with acute pulmonary embolism (APE). Previous studies have suggested that several cardiac biomarkers such as cardiac troponins or natriuretic peptides can improve risk stratification of patients with APE.6-12) However, because of its simplicity, widespread availability and low cost, the 12-lead electrocardiogram (ECG) has definite clinical advantages for the emergency triage of patients with APE. Among various ECG findings, some studies focused on inverted T waves in the precordial leads and found them to be related to RVD in patients with APE.13-16)
This study was conducted to compare the clinical usefulness of ECG findings and cardiac biomarkers for the assessment of RV involvement and short-term prognosis in patients with acute pulmonary embolism.
Subjects and Methods
The medical records of 92 consecutive patients with an acute pulmonary embolism that were treated at the Kangdong Sacred Heart Hospital between January 2004 and February 2008 were reviewed retrospectively. The diagnosis of APE was confirmed by high-resolution computed tomography of the chest. The exclusion criteria were chronic obstructive pulmonary disease or cor pulmonale, dilated cardiomyopathy, and evidence at ECG of right ventricular hypertrophy, suggesting long-standing RVD.
Transthoracic ECG was performed within 24 hours of presentation.17) Patients with one or more of the following were considered to have RV dysfunction: 1) RV dilatation (end-diastolic diameter >30 mm in the parasternal long axis view), 2) RV free wall hypokinesia, and 3) paradoxical septal systolic motion. The study population was grouped as patients with or without RVD.
We analyzed the ECG findings previously shown to be associated with pulmonary embolism: 1) T-wave inversion (TWI) in the precordial leads, 2) S1Q3T3, 3) complete or incomplete right bundle branch block (RBBB), 4) sinus tachycardia, 5) peripheral low voltage, and 6) pulmonary P waves.15)18) Precordial TWIs were defined by the presence of pointed and symmetrical inverted T waves from V1 to V3 or beyond. The S1Q3T3 pattern was defined according to the criteria of McGinn and White {S wave in lead I and Q wave in lead III, with an amplitude of more than 0.15 mV (1.5 mm) associated with TWIs in lead III}. A right bundle branch block was defined according to conventional criteria. Sinus tachycardia was defined as an increase in sinus rhythm to >100 beats/min. Peripheral low QRS voltage was defined when the amplitude of the largest QRS deviation (positivity or negativity) in the peripheral leads was <5 mm. Pulmonary P waves were defined when its amplitude reached 0.25 mV in lead II. If a patient showed serial ECG changes all ECG patterns were analyzed.
Blood samples were obtained within 24 hours of presentation. Cardiac troponin I (cTnI) levels were determined using the immunometric assay (ADVIA Centaur, Bayer Diagnostics, Tarrytown, NY, USA). Detectable plasma cTnI levels (>0.78 ng/mL) were considered to be elevated. B-type natriuretic peptide (BNP) was measured on the ADVIA Centaur system (Bayer Diagnostics, Tarrytown, NY, USA) on plasma specimens. The normal range of BNP was less than 100 pg/mL.
Continuous variables were expressed as the mean±SD. The dichotomous variables were expressed as a percent. Statistical comparisons of the continuous variables were performed by the Student's t test. Chi-square analysis was used to compare categorical variables. A p<0.05 was considered to be statistically significant. All statistical analyses were performed with Statistical Package for Social Science (SPSS) 12.0 for Windows (SPSS Inc., Chicago, IL, USA).
Results
Study population
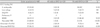
Among 92 patients diagnosed with APE, 44 were excluded from the study (38 with missing data for the biomarkers; either troponin or BNP, or both, 4 with dilated cardiomyopathy or New York Heart Association class III or IV heart failure, 2 with a chronic pulmonary embolism). The mean age of the study population was 66±15 years, and 52.1% of patients were women. Among 48 of the study patients, 20 (41.7%) had normal RV function, and the other 28 (58.3%) had RV dysfunction. There were more patients presenting with shock, defined as persistent systolic arterial pressure less than 90 mmHg and clinical signs of organ hypoperfusion (clouded sensorium, oliguria, and cold and clammy skin) among patients with RVD (p=0.007). Six patients (12.5%) died during the hospital admission, and among these six deaths, five patients were in the group with RVD. The mean value for cardiac troponin I was significantly higher in patients with RVD compared to patients without RVD (0.76±1.14 vs. 0.15±0.91 mg/dL, p=0.015); however, this value was not considered to be elevated (>0.78 mg/dL). The levels of BNP were not significantly different between the patients with RVD and those without RVD (Table 1).
Electrocardiographic findings
Among the 48 patients, only four patients (8.3%) had normal electrocardiographic results. Eight patients had atrial fibrillation. No patient had pulmonary P waves. TWIs in the precordial leads were the most prevalent findings (45.8%) and low voltage the least (12.5%). TWIs in leads V1 to V3, or more, were significantly more frequent in patients with RV dysfunction than in those without RV dysfunction (75.0% vs. 5.0%, p<0.0001). Similarly, sinus tachycardia and complete or incomplete RBBB were significantly more frequently observed in patients with RV dysfunction than in those without RV dysfunction (50.0% vs. 15.0%, p=0.012, and 46.4% vs. 15.0%, p=0.023, respectively). Although the mean cTnI value was greater in patients with RVD than in patients without RVD (p=0.015) (Table 1), the frequency of elevated cTnI was not significantly different between the two groups. The frequency of elevated BNP was greater in patients with RVD than in those without RVD, however, this difference did not reach statistical significance (Table 2). Of the electrocardiographic criteria studied for the prediction of RV dysfunction, precordial TWIs had a sensitivity of 75.0%, specificity of 95.0%, and positive and negative predictive values of 95.5% and 73.1%, respectively.
Normalization of T-wave inversion and improvement of right ventricular dysfunction
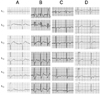
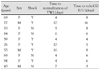
Among 21 patients with RVD that showed TWI on the ECG, 12 patients had normalization of the T-wave inversions during hospitalization. Ten patients showed improved RVD on ECG. Table 3 summarizes age, gender, presence of shock, the time to normalization of TWI, and the time to confirmation of improvement of RVD on the ECG of these patents. The interval to ECG change and echocardiographic change were similar as shown in Table 3. Fig. 1 shows serial ECG changes in a representative case. Note that TWIs appeared on the day of the event and normalization of the T-wave with time, associated with improvement of the right ventricular dysfunction.
Discussion
In the present study, we compared well-known electrocardiographic features with biomarkers of APE to determine their utility for the identification of RV dysfunction. TWIs in the precordial leads had good specificity and moderate sensitivity for the identification of RV dysfunction, consistent with the findings of previous studies.9)13)19) Several prior studies have shown the usefulness of cardiac troponin and BNP for the detection of RVD.7)8)20) However, the results of this study showed no significant association between the elevation of cTnI or BNP and RVD on transthoracic ECG.
The pathophysiology of T-wave changes in the precordial leads is not well-established. Some authors attribute them to coronary insufficiency.19) However, there have been contradictory reports linking high coronary blood flow with PE that drops only during the final stages. Others have suggested a cathecholamine-mediated phenomenon as in other clinical conditions known to cause global TWIs.19)21) However, there is not enough evidence to support this theory.
Persistent RVD is known to be associated with recurrent thromboembolic events.22) The optimal timing for follow-up of right ventricular function is not known. Yoshigawa et al.19) reported serial changes of negative T waves in 15 patients with acute massive pulmonary embolisms. They reported that disappearance of the TWI was associated with improvement of pulmonary hypertension, consistent with our findings. Therefore, the disappearance of TWIs may guide the clinician to the appropriate time for follow up ECG to evaluate the patient for RV function.
This study was conducted retrospectively and the interpretation of the findings is limited by the small sample size. The study population with RVD was greater than the patients without RVD; the cardiac troponin and BNP were usually measured in the patients with RVD. The timing for the follow-up ECG was not consistent; therefore, the exact time that the RVD improved could not be confirmed. Prospective studies with larger numbers of patients are required to investigate the usefulness of TWIs for guiding the clinician in the time to perform follow-up ECG to confirm improvement of RVD.
In conclusion, electrocardiographic features of negative TWIs in the precordial leads was a more reliable finding for the identification of RV dysfunction in patients with acute pulmonary embolism compared to biomarkers such as cardiac troponin and BNP. In addition, improvement of RV function can be confirmed by the disappearance of TWI in patients with such ECG changes.

 XML Download