

 PDF
PDF ePub
ePub Citation
 Print
Print


Abstract
Background and Objectives
The newly developed 2-dimensional ultrasound speckle tracking imaging (2D-STI) has enabled researchers to assess the changes of left ventricular (LV) rotation and torsion. The aims of the present study are to establish normal values and to examine the effect of advancing age on left ventricular torsion.
Subjects and Methods
We enrolled 182 healthy persons in this study. After examined the standard clinical echocardiographic parameters, we obtained the degree of the LV rotation at the basal and apical levels of the short axis view with using a customized software program EchoPAC, GE.
Results
Among the 182 healthy subjects, 109 healthy subjects were finally included (49 males and 60 females) due to the failure of obtaining reliable rotational patterns (feasibility: 59.8%). The basal and apical peak LV rotations during systole were 8.14±3.55 degrees and 8.48±3.70 degrees, respectively. The basal peak LV rotation and peak LV torsion had a tendency to increase with aging (r=0.277, p=0.004 and r=0.253, p=0.008, respectively). All the values of the basal LV rotation during systole tended to increase with aging. The apical LV rotation had no relationship with aging throughout the entire cardiac cycle.
References
1. Helle-Valle T, Crosby J, Edvardsen T, et al. New noninvasive method for assessment of left ventricular rotation: speckle tracking echocardiography. Circulation. 2005; 112:3149–56.
2. Lakatta EG, Levy D. Arterial and cardiac aging: major shareholders in cardiovascular disease enterprises: part II. the aging heart in health: links to heart disease. Circulation. 2003; 107:346–54.
3. Nagueh SF, Middleton KJ, Kopelen HA, Zoghbi W, Quinones MA. Doppler tissue imaging: a noninvasive technique for evaluation of left ventricular relaxation and estimation of filling pressures. J Am Coll Cardiol. 1997; 30:1527–33.

4. Ommen SR, Nishimura RA, Appleton CP, et al. Clinical utility of Doppler echocardiography and tissue Doppler imaging in the estimation of left ventricular filling pressures: a comparative simultaneous Doppler-catheterization study. Circulation. 2000; 102:1788–94.
5. Quinones MA, Otto CM, Stoddard M, Waggoner A, Zoghbi WA. Recommendations for quantification of Doppler echocardiography: a report from the Doppler Quantification Task Force of the Nomenclature and Standards Committee of the American Society of Echocardiography. J Am Soc Echocardiogr. 2002; 15:167–84.
6. Lakatta EG, Levy D. Arterial and cardiac aging: major shareholders in cardiovascular disease enterprises: part I. aging arteries: a “set up” for vascular disease. Circulation. 2003; 107:139–46.
7. Arbab-Zadeh A, Dijik E, Prasad A, et al. Effect of aging and physical activity on left ventricular compliance. Circulation. 2004; 110:1799–805.
8. Taber LA, Yang M, Podzsus WW. Mechanics of ventricular torsion. J Biomech. 1996; 29:745–52.
9. Matter C, Nagel E, Stuber M, Boesiger P, Hess OM. Assessment of systolic and diastolic LV function by MR myocardial tagging. Basic Res Cardiol. 1996; 91:23–8.
10. Oxenham HC, Young AA, Cowan BR, et al. Age-related changes in myocardial relaxation using three-dimensional tagged magnetic resonance imaging. J Cardiovasc Magn Reson. 2003; 5:421–30.
11. Fonseca CG, Oxenham HC, Cowan BR, Occleshaw CJ, Young AA. Aging alters patterns of regional nonuniformity in LV strain relaxation: a 3-D MR tissue tagging study. Am J Physiol Heart Circ Physiol. 2003; 285:H621–30.
12. Takeuchi M, Nakai H, Kokumai M, Nishikage T, Otani S, Lang RM. Age-related changes in left ventricular twist assessed by two-dimensional speckle-tracking imaging. J Am Soc Echocardiogr. 2006; 19:1077–84.
13. Kim HK, Sohn DW, Lee SE, et al. Assessment of left ventricular rotation and torsion with two-dimensional speckle tracking echocardiography. J Am Soc Echocardiogr. 2007; 20:45–53.
14. Hees PS, Fleg JL, Dong SJ, Shapiro EP. MRI and echocardiographic assessment of the diastolic dysfunction of normal aging: altered LV pressure decline or load? Am J Physiol Heart Circ Physiol. 2004; 286:782–8.
15. Yamakado T, Takagi E, Okubo S, et al. Effects of aging on left ventricular relaxation in humans: analysis of left ventricular isovolumic pressure decay. Circulation. 1997; 95:917–23.
16. Hoit BD, LeWinter M, Lew WY. Independent influence of left atrial pressure on regional peak lengthening rates. Am J Physiol. 1990; 259:H480–7.
17. Ballester-Rodes M, Flotats A, Torrent-Guasp F, et al. The sequence of regional ventricular motion. Eur J Cardiothorac Surg. 2006; 29(Suppl 1):S139–44.
Fig. 1.
Left ventricular rotation (A), torsion (B), rotational velocity (C), and torsional velocity (D)profile curves are presented. ∗Means significant correlation with aging by univariate regression analysis, which has been presented on Table 2. All data are plotted as function of time normalized to one cardiac cycle (RR interval). Positive Y-axis values indicate counterclockwise rotation, and negative Y-axis values clockwise rotation. LV rotation: left ventricular rotation, LV torsion: left ventricular torsion.
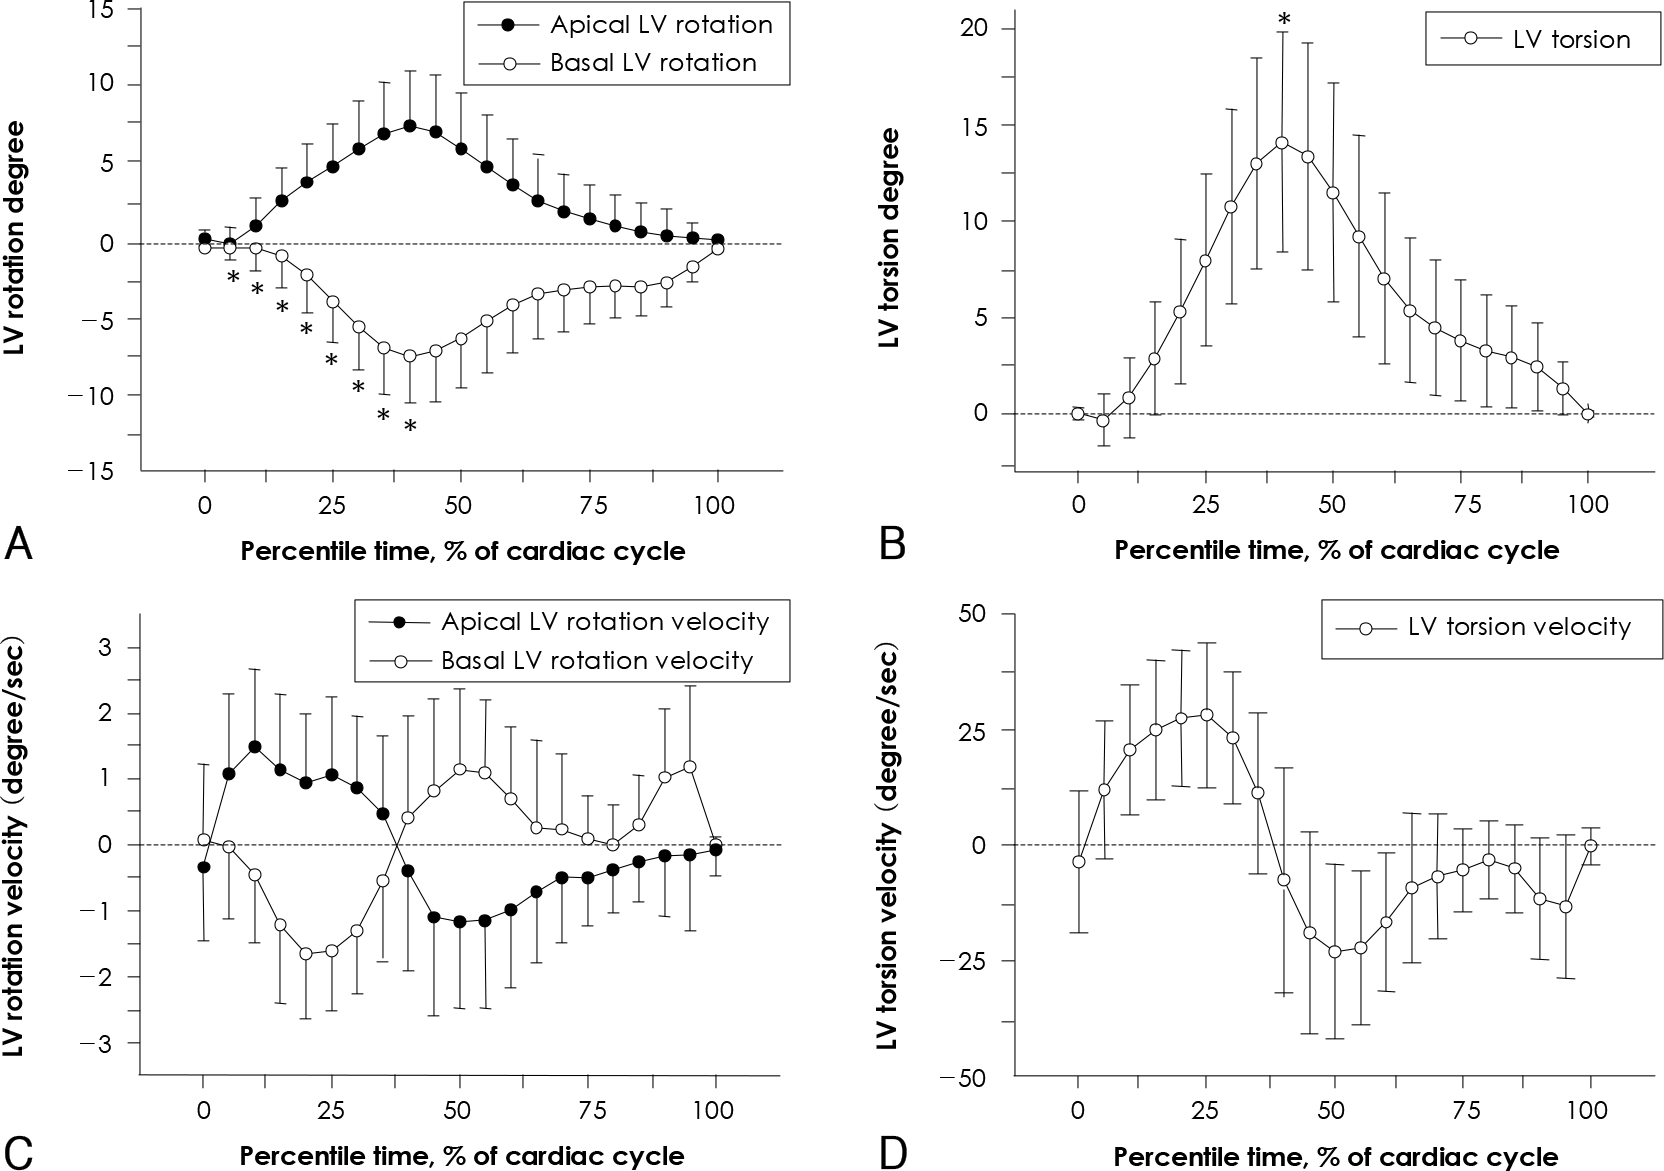
Fig. 2.
Correlations between age and basal peak LV rotation (A), apical peak LV rotation (B)and peak LV torsion (C) are presented. The basal peak LV rotation and peak LV torsion have a meaningful tendency to increase with aging (r=0.277, p=0.004 and r=0.253, p=0.008, respectively). The apcial peak LV rotation has no relationship with aging (r=0.092, p=0.340). LV rotation: left ventricular rotation, LV torsion: left ventricular torsion.
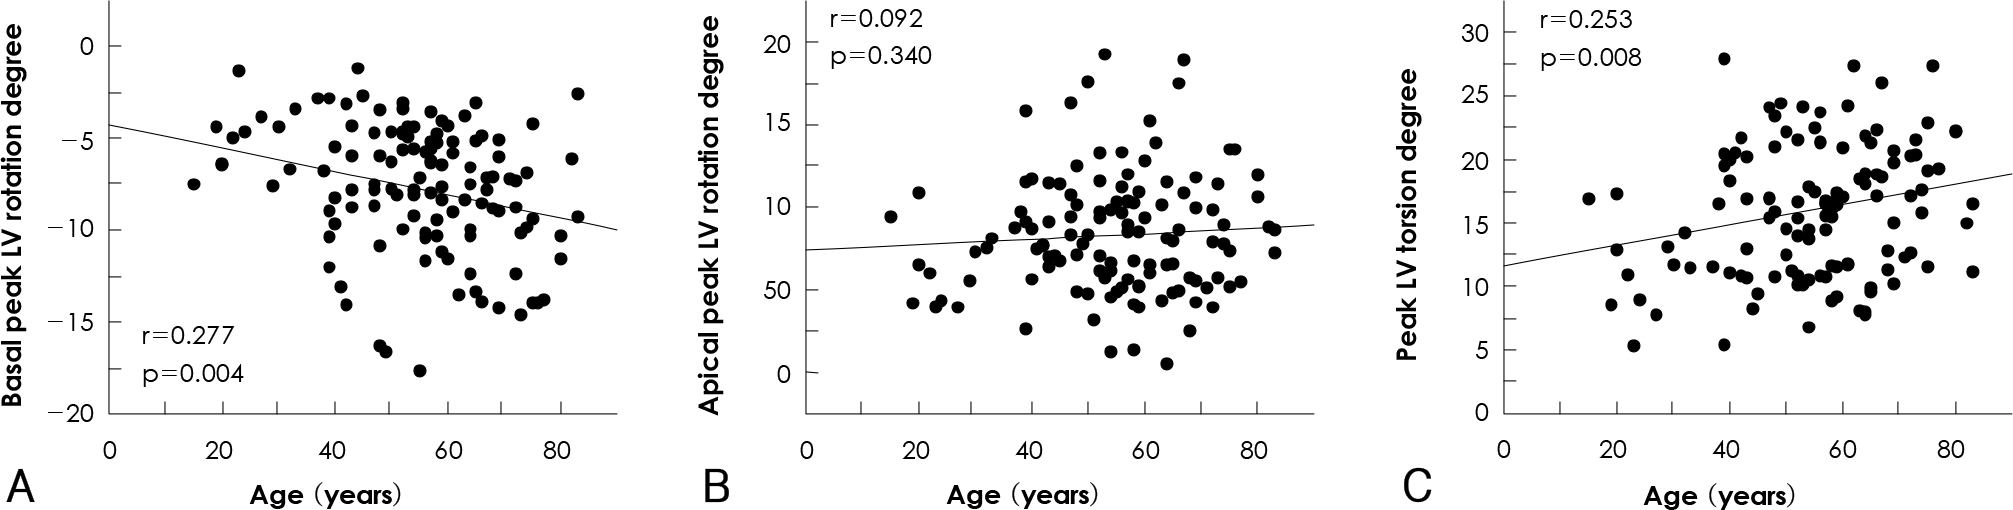
Table 1.
Demographic and echocardiographic parameters of the different age groups
All values of the quartiles were tested by ANOVA, but the frequency of gender was tested with Chi-square tests.?BMI: body mass index, EF: ejection fraction, DT: deceleration time, IVRT: isovolumic relaxation time, Sm: tissue Doppler imaging of the septal mitral annulus, NS: not significant, RR: R wave to the next R wave in the electrocardiogram, ANOVA: analysis of variance
Table 2.
The Left ventricular rotation and torsion parameters in different age groups and according to aging
| Parameters | 1st quartile | 2nd quartile | 3rd quartile | 4th quartile | ANOVA | Regression on age | |
|---|---|---|---|---|---|---|---|
| (n=27) | (n=28) | (n=26) | (n=28) | p | r | p | |
| Basal pLV rotation (degree) | –7.1±3.9∗ | –8.2±3.8 | –7.9±3.0 | –9.3±3.2∗ | NS | 0.277 | 0.004† |
| Apical pLV rotation (degree) | 7.8±3.0 | 9.5±4.0 | 7.8±3.6 | 8.8±3.9 | NS | 0.092 | 0.340 |
| pLV trorsion (degree) | 14.9±6.2∗ | 17.6±4.6 | 15.6±5.1 | 18.1±4.4∗ | 0.05 | 0.253 | 0.008† |
| Basal LV rotation values according to the percentile time of the cardiac cycle (RR interval) | |||||||
| 5% of RR interval | 0.36±0.97 | 0.26±1.18 | 0.26±0.98 | –0.64±1.45 | 0.005 | 0.315 | 0.001† |
| 10% of RR interval | 0.53±1.72 | 0.29±2.01 | 0.30±1.78 | –1.08±1.24 | 0.002 | 0.352 | 0.000† |
| 15% of RR interval | 0.53±2.11 | –0.39±2.56 | –0.01±2.31 | –2.02±1.83 | 0.000 | 0.404 | 0.000† |
| 20% of RR interval | –0.43±2.23 | –2.17±3.06 | –1.13±2.76 | –3.26±2.55 | 0.001 | 0.369 | 0.000† |
| 25% of RR interval | –2.13±2.54 | –3.98±3.03 | –3.12±3.13 | –4.69±2.76 | 0.009 | 0.324 | 0.001† |
| 30% of RR interval | –3.89±3.08 | –5.47±3.14 | –4.94±3.22 | –6.34±2.74 | 0.03 | 0.305 | 0.001† |
| 35% of RR interval | –5.25±3.36 | –6.46±3.48 | –6.70±3.02 | –7.79±2.95 | 0.04 | 0.335 | 0.000† |
| 40% of RR interval | –6.17±3.50 | –6.84±3.81 | –7.31±2.95 | –8.28±3.28 | NS | 0.285 | 0.003† |
| 45% of RR interval | –6.47±3.89 | –6.56±3.88 | –6.15±2.77 | –7.81±3.82 | NS | 0.170 | 0.076 |
| 50% of RR interval | –6.06±4.01 | –5.68±3.81 | –5.20±2.42 | –6.82±3.99 | NS | 0.110 | 0.257 |
| 55% of RR interval | –5.46±4.03 | –4.48±3.78 | –3.71±2.61 | –5.51±3.91 | NS | 0.041 | 0.668 |
| 60% of RR interval | –4.51±3.61 | –3.36±3.47 | –2.69±2.42 | –4.24±3.93 | NS | 0.012 | 0.897 |
| 65% of RR interval | –3.74±3.09 | –2.79±2.87 | –2.01±2.69 | –3.49±3.82 | NS | 0.013 | 0.895 |
| 70% of RR interval | –3.34±2.76 | –2.49±2.28 | –2.06±3.47 | –3.03±3.20 | NS | 0.026 | 0.780 |
| 75% of RR interval | –3.13±2.25 | –2.32±2.14 | –1.73±2.97 | –3.03±3.20 | NS | 0.038 | 0.693 |
| 80% of RR interval | –2.89±1.97 | –2.37±1.99 | –1.83±2.62 | –2.87±2.87 | NS | 0.039 | 0.687 |
| 85% of RR interval | –2.72±1.86 | –2.32±1.81 | –2.12±2.43 | –2.93±2.76 | NS | 0.009 | 0.925 |
| 90% of RR interval | –2.29±1.64 | –1.95±1.80 | –2.01±1.98 | –2.73±2.35 | NS | 0.038 | 0.696 |
| 95% of RR interval | –1.14±1.12 | –0.86±1.56 | –1.19±1.19 | –1.67±1.40 | NS | 0.111 | 0.253 |
| 100% of RR interval | –0.06±0.33 | –0.03±0.20 | –0.02±0.05 | –0.04±0.24 | NS | 0.001 | 0.991 |
 XML Download