

 PDF
PDF ePub
ePub Citation
 Print
Print


Introduction
The ventricular tachycardia (VT) or premature ventricular contraction (PVC) that origonates from the right ventricular outflow tract (RVOT) results in a typical left bundle branch block (LBBB)-like morphology and an inferior-axis. Radiofrequency catheter ablation (RFCA) is known to have a high success rate for treating most patients with RVOT VT or PVC.1-5) In patients who cannot be ablated from the RVOT, then the left ventricular outflow tract (LVOT), the aortic cusp (AC) or the pulmonary artery should be considered as a non-RVOT focus.6-10) It has been reported that compared to the PVC or VT from the RVOT, the PVC or VT from the AC, and specifically from the left coronary cusp (LCC), had distinct electrocardiogram (ECG) characteristics, that is, a longer R-wave duration and a higher R/S amplitude ratio on the V1-2 leads.6) This may be caused by complex spatial relationships between the AC and the adjacent anatomical structures. The purpose of this study was to characterize the ECG morphology of the PVC or VT from the AC and to assess whether these foci exit out to the surrounding epicardium through a preferential conducting pathway, resulting in ECG characteristics that are similar to those of epicardial foci.
Subjects and Methods
Patient population
The study subjects were ten consecutive patients (6 males and 4 females with a mean age of 40.9±11.6 years) with VT (n=4) or drug refractory frequent PVC (n=6) that originated from the AC and these patients underwent RFCA at Korea University Medical Center, Seoul, Korea. None of the patients had significant structural heart disease.
The surface ECG of the clinical PVCs showed early transition in leads V1 and V2, and positive voltage in leads II, III and aVF. Their intrinsicoid deflection times were prolonged. The patients all underwent medical history taking, physical examination, laboratory analysis, chest radiography, 12 lead ECG, 24-h Holter ECG monitoring, 2-dimensional echocardiogram before RFCA and then again 6 to 12 months after RFCA.
Electrophysiologic study
Activation mapping
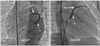
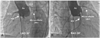
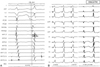
Electrophysiologic studies and RFCA were performed after all the patients' antiarrhythmic medications had been discontinued. All the procedures were performed after written informed consent was obtained from the patients. Under local anesthesia, catheters were inserted through the right femoral vein and artery under fluoroscopic guidance. One 7 Fr sheath was introduced into the right femoral artery for trans-aortic access. An 8 Fr long sheath (8 Fr SL-1, St. Jude Medical Inc, St. Paul, MN, USA) was positioned in the left atrium (LA) by trans-septal puncture with using a Brockenbrough needle. An occlusive coronary sinus venogram (Fig. 1) and aortogram (Fig. 2) were performed. A micromapping catheter (Cardima™, Pathfinder, Fremont, CA, USA) was inserted through the anterior interventricular vein (AIV) and we performed activation mapping of the earliest epicardial potentials (Fig. 3). A 5 mm ablation catheter (5 mm tip Blazer II HTD catheter, Boston Scientific, Natick, MA, USA) was located in the AC via the transarotic approach and a 4 mm ablation catheter was located at the anterior mitral annulus (AMA, endocardial exit side) via the 8 Fr sheath located in the LA. By conventional activation and pace mapping with or without isoproterenol infusion (3-5 µg/min), PVCs with the same QRS morphology as that of VT were reproducibly induced. Activation mapping identified the bipolar ventricular electrogram preceding the onset of the QRS. If the PVCs or VT were infrequent, then pace mapping was performed by a pulse width of 2 ms with twice the diastolic threshold. The ablation target was defined by the earliest activation and this was perfectly matched with the pace mapping (Fig. 4). Then we then delivered several RF bursts of energy on those foci after performing coronary angiography to avoid coronary arterial damage. The RF energy was started at 15 to 30 W to reach the target temperature.
Measurements and calculations
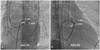
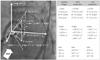
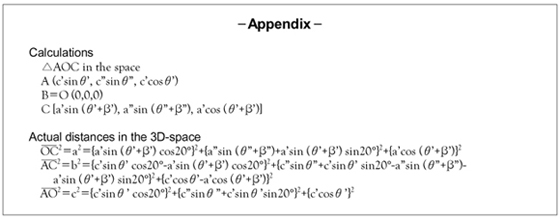
To determine and compare each of the conduction velocities, we measured the conduction times and distances among the catheters on the two 2-D fluoroscopic images: the right anterior oblique 35 degrees right anterior oblique (RAO 35°) image without cranial or caudal angulation, and the left anterior oblique 35 degrees left anterior oblique (LAO 35°) image without cranial or caudal angulation, respectively. We drew an imaginary longitudinal axis of the body and the triangles consisted of the 3 earliest activation points of these catheters (Fig. 5). The distances and the angles on each radiographic image were measured. Using those values and with performing triangular algebra, we could calculate the estimated actual distances between the 3 above-mentioned points (Fig. 5, Labview, National Instrument, Inc. USA, Appendix). The calculated estimated actual distances were calculated from the measured distances and angles on the 2D fluoroscopic images and they were divided by their conduction times.
Electrocardiogram analysis
The intervals on the surface 12-lead ECG were measured with electronic calipers (Prucka, CardioLab EP, Prucka Engineering Inc., Houston, TX, USA). The spontaneous or induced PVCs or VTs were analyzed. We assessed the QRS morphology, QRS duration, axis, precordial transition zone, voltage in every lead and the maximal deflection time (MDT). The QRS duration of the PVC was measured as the interval between the earliest rapid deflection in any of the 12 leads and the latest offset in any lead. Time to maximum deflection was measured from the onset of the QRS complex to the maximal deflection in each precordial lead. The maximal deflection was defined as the largest amplitude deflection either above or below the isoelectric line. The time to maximal deflection was divided by the QRS duration to obtain the maximal deflection index (MDI). The MDI was seperately calculated for each precordial lead.
Results
Catheter ablation
All the patients underwent RFCA that was guided by activation and pace mapping at the perivascular epicardial area via both the trans-aortic approach and transseptal puncture.
Seven patients had their target site above the LCC. One patient's target site was below the LCC, one patient's target site was above the right coronary cusp (RCC) and one patient's target site was below the RCC. A mean earliest endocardial activation time was 33.7±14.8 ms before the QRS, and optimal pace mapping was obtained in seven out of ten patients. Procedural success was achieved in all patients. The mean number of delivered RFs was 2.8±2.7 times. The mean time to elimination of the PVC was 4.5±2.6 sec after RF delivery.
During 9.0±4.8 month of follow-up, only one patient who had been given low RF energy, i.e., 15 W, 50℃, experienced recurred PVC. After re-ablation with 50 W, 60℃ at 6 months after the initial ablation, the patient's PVC was successfully eliminated.
12-lead electrocardiogram morphology
For the PVCs or VTs of an LCC origin, their surface ECG showed a tall R wave in V1, early transition (the transition zone was between lead V1 and lead V3), negativity in lead I and a R wave in the inferior leads. The surface ECG of the RCC origin showed a S or rS wave in V1, the early transition became less right sided and positivity was observed in lead I (Table 1). The mean QRS duration of the PVCs was 149.2±19.9 ms. The mean MDT was 88.9±14.9 ms and the ratio of the MDT to the QRS duration was 59.5±5.7%, respectively.
Conduction properties
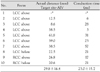
The conduction velocity from the focus to the AIV (epicardial exit side) was 1.7±0.8 m/s, whereas the conduction velocity from the focus to the AMA (endocardial exit side) was 0.8±0.4 m/s (Table 2). The conduction velocity to the epicardial side was significantly faster than that to the endocardial adjacent structure (p<0.05), suggesting the existence of a preferential conducting pathway from the PVC focus to the epicardial exit.
Discussion
The types of VT that occur in the absence of structural heart disease include right ventricular (RV) monomorphic extrasystoles, RVOT VT, LVOT VT, idiopathic LV tachycardia (ILVT), etc. All these are referred as idiopathic VTs.11)12) VTs from the RVOT and LVOT share similar electrophysiological and clinical presentations; therefore, they are collectively called outflow tract VTs (OTVTs). Among the OTVTs, 90% originate from the RVOT and 10% originate from the LVOT.11) 70% of the cases of idiopathic RVOT VT arise from just inferior to the pulmonic valve.13) A subgroup of OTVTs that originated from AC have recently been reported on.14) The reported prevalence of AC VT in idiopathic OTVT was about 12.5%14) or 13%.9) The patients with AC VTs are generally young, resistant to medical treatment and can be treated with a few bursts of RF energy.15) It is also been known that there are some idiopathic VTs that are resistant to drugs or RFCA with using the conventional endocardial approach.8)15) This incidence of refractory idiopathic VTs is similar to the rates of unsuccessful catheter ablation of OTVTs from subendocardial sites.10)14)16) This finding indicates that AC VT is one of the important causes of the failure of RFCA for treating OTVT with using only the endocardial approach.
Electrocardiogram characteristic of premature ventricular contraction or ventricular tachycardia from the aortic cusp
As compared with other OTVTs, the ECG characteristics of AC VTs have not been well characterized. The characteristic ECG morphology of an RVOT VT is a wide QRS complex tachycardia with a LBBB pattern and an inferior axis.6)17) The surface ECG of AC VTs shared characteristics that were similar with that of RVOT VTs; however, the indexes of the R wave duration and the R/S wave amplitude have been demonstrated to be useful for differentiating between RVOT VT and AC VT.6) For the details, the surface ECG of endocardial LVOT VT showed RBBB morphology in the precordial leads, a notch in V6 and an inferior axis in leads II, III, and aVF.6) An ACVT of an RCC origin had a tall R wave in lead I and a narrow QRS complex in V1 and V2.6)
For patients with VTs, if their ECG characteristics are an R wave in V1, early transition,18) negative in lead I and a wide QRS complex with a delayed intrinsicoid deflection time (> than 55%), then we should bear in mind that the AC must be considered as one of the foci.7) Among the ECG characteristics of an AC VT, tall R waves in the inferior leads are the most sensitive for identifying an LVOT epicardial VT.14) LVOT epicardial VT can never be diagnosed by precordial R wave transition, yet precordial transition >V4 was not observed for the epicardial LVOT or endocardial VT. The absence of a S wave in V6 is another significant feature of a LVOT epicardial VT.19) The area of the LVOT epicardium is relatively large and this includes the proximal left coronary artery, the AIV and the great cardiac vein on its surface. It is important to precisely localize the VT origin in the LVOT because some LVOT epicardial VTs can be ablated from the main pulmonary artery, the AIV, the great cardiac vein or the direct epicardial surface. Understanding these distinct ECG characteristics of AC VTs before performing RFCA can enable a physician to save time during the electrophysiologic study and lower the recurrence rate after ablation.
Epicardial preferential conduction of premature ventricular contraction or ventricular tachycardia from the aortic cusp
The ectopic muscular tissue is connected with the LV. Both the embryonic avian and mammalian outflow tracts, as well as the outflow tract in adult primitive fish and amphibians, are surrounded by the myocardium.20) In contrast to the myocardium of the atrial and ventricular chambers, this myocardium retains its embryonic features, i.e., slow propagation of the depolarizing impulse owing to the poor intercellular coupling of the cardiac muscle cells.20) In normal mammalian development, the proximal outflow tract myocardium becomes ventricularized by incorporation into the LV, whereas the myocardium of the distal outflow tract disappears. It can be envisioned that if this retraction of myocardium does not disappear completely, then remnants persist that may provide the substrate for these tachycardias. Yet because the have little vascularity, the ventricular arrhythmia caused by them is resistant to medical treatment.
The faster epicardial conduction velocity of the PVC or VT from the AC in this study suggests that a muscular connection between the foci and the epicardial exit may exist. It has been suggested that OTVTs originate from the muscular sleeve of the great vessels connected to the heart.21) As Ouyang et al.6) demonstrated, somewhat heterogeneous tissues that have different conduction properties exist around target sites. The pulmonic veins, superior vena cava, coronary sinus and ligament of Marshall may contain arrhythmogenic myocardial tissue, resulted in atrial fibrillation.22)23) As was noted in atrial fibrillation, the muscular tissue in the great vessels that are connected to the ventricle harbors triggers or it provides the arrhythmogenic substrate for ventricular arrhythmias. The existence of a muscular sleeve was confirmed histologically in postmortem study, and some myocardium was contained in the AC.6)16)21) Removal of this connection by performing RFCA can be curative therapy for this condition.
Because of the faster epicardial conduction velocity, it may be difficult to localize the foci from the AC by mapping only at the endocardial side. Thus, we performed detailed mapping via the cardiac vein.
Study limitation
This study lacked histologic confirmation of the muscular pathways from the AC to the surrounding LVOT epicardium. We also obtained the conduction velocity by calculation and triangular algebra based on only the 2-D fluoroscopic images, which may have limited our ability to quantify the anatomical relation between complex 3-D structures. Further study that would include a larger number of the patients with histologic validation is required to clarify and revalidate our findings.
Conclusion
An aortic cusp origin should be considered for patients with ventricular arrhythmias that show early precordial transition and a long maximal depolarization time. Most of these foci were successfully ablated at the above LCC by minimal RF delivery. The epicardial conduction velocity from the AC to the AIV was significantly faster than the endocardial conduction velocity from the AC to the AMA, suggesting the existence of preferential conduction through the musculature between the AC and the LV epicardium.
 XML Download