

 PDF
PDF ePub
ePub Citation
 Print
Print


Introduction
A high survival rate is the current trend in patients with congenital heart disease (CHD) because of improved medical and surgical treatments. Many patients with CHD since childhood are entering adulthood after passing through adolescence.1) However, many such children have numerous restrictions that affect their life. Furthermore, parents of these children tend to be overprotective because they presume that exercise is harmful for their children. This presumption is the result of confusion and uncertainty regarding their child's ability to exercise and the benefits and risks of exercising.2) In these aspects, it is better to follow-up CHD children by evaluating their functional ability during exercise rather than at rest. The findings of this follow-up can inform the children and their parents about the exercise capacity and aid them in participating in appropriate exercise. Clinical modalities, including chest radiograph, echocardiography, and pulmonary function test, have limitations in reflecting the functional ability during normal activities because these modalities are performed only at rest. In contrast, the cardiopulmonary exercise test (CPET) has advantages in that it can clarify a patient's exercise capacity objectively by reflecting the metabolic, ventilatory, and cardiovascular responses of the body to exercise.3) This study aimed to assign children with several types of CHDs to perform CPET and to evaluate the usefulness of CPET in these children.
Subjects and Methods
Subjects
The study population comprised 48 children and adolescents (18 girls and 30 boys; mean±SD age, 12.6±0.5 years) with CHD who could tolerate exercise. It included 12 patients who had undergone Fontan operation for single ventricle physiology; 13 patients, total correction for tetralogy of Fallot (TOF); 11 patients, repair for coarctation of aorta (CoA); and 12 patients, correction for simple CHDs including ventricular septal defect, atrial septal defect, and patent ductus arteriosus.
The mean elapsed time from the corrective surgeries was 10.6 years, and it was not significantly different among the groups. Patients with simple CHDs who had undergone an early surgery were selected as controls, the definition of which was evidenced by a recent study on the normality of cardiopulmonary capacity in children on to corrected CHDs.4) The New York Heart Association (NYHA) functional class was determined based on a the assessment of the patients by a physician and the symptoms on the day of the exercise tests reported by parents. Table 1 presents the mean age, gender distribution, weight, height, body surface area, mean elapsed time after corrective surgeries, NYHA functional class, and progressive exercise time in each group.
Study design
All subjects were assigned to undergo a resting pulmonary function test (Vmax series, Viasys, CA, USA) followed by CPET on a programmable treadmill (Series 2000, Marquette, GE, KY, USA). The leads for obtaining a 12-lead electrocardiogram, a blood pressure cuff, and a pulse oximeter (N-550, Nellcor, CA, USA) were applied to the subjects for monitoring their cardiovascular responses. Ventilatory and gas exchange data were obtained on a breath-by-breath basis by using a computerized system (Vmax series) while the subjects breathed through a tight-fitting mask connected to the machine for continuous measurement of inspired and expired volumes and gas exchanges. We calibrated this system everyday to obtain accurate measurements. Informed consent was obtained from each subject's parents prior to the exercise test.
Exercise protocol
All the subjects performed the exercise on a motor-driven, programmable treadmill. We adopted the ramp-like protocol developed by Ohuchi et al.5) Furthermore, we modified this protocol for subjects who were completely exhausted at approximately 10 minutes after the progressive exercise (Table 2). We chose an appropriate protocol from among protocols 1, 2, 3, and 4 according to the subjects' daily activities based on their past history and NYHA functional class.
After performing the resting pulmonary function test, the subjects were rested for 4 minutes and then instructed to perform a 3-minute warm-up walk (speed, 1-1.5 km/hour; grade, 0%). Subsequently, progressive exercise was performed by increasing the speed and grade of the treadmill at every 1 minute until the subjects' exhaustion. After peak exercise, the subjects were allowed to recover for 3 minutes by decreasing the speed and grade of the treadmill at every 1 minute until the treadmill stopped. The exercise was halted when one of the following conditions occurred: (1) subjects experienced fatigue, (2) severe systolic hypertension greater than 230 mmHg, or (3) target respiratory exchange ratio (RER) greater than 1.1.
Cardiovascular and ventilatory responses
To investigate the cardiovascular responses to exercise, we measured the heart rate, systolic blood pressure (SBP), and diastolic blood pressure (DBP), assessed the electrocardiographic changes, and calculated the O2 pulse. The latter was calculated by dividing the O2 consumption (VO2) by the simultaneously measured heart rate.6) For investigating the ventilatory responses to exercise, we measured the minute ventilation (VE), tidal volume VT), and respiratory rate (RR) and calculated the exercise breathing reserve (BR). BR was defined as (maximal voluntary ventilation-VE at peak exercise)/maximal voluntary ventilation and was expressed as a percentage.6) Maximal voluntary ventilation was revealed by the resting pulmonary function test.
Measurement of metabolic and pulmonary gas exchanges
To investigate the metabolic and pulmonary gas responses to exercise, VO2, CO2 production (VCO2), RER, VE/VCO2, and VE/VO2 at peak exercise and VO2 at an anaerobic threshold (AT) were measured in real time. Arterial O2 saturation as indicated by the pulse oximeter (SpO2) was also obtained. RER, termed the gas exchange ratio, was defined as the ratio of CO2 production to O2 consumption (VCO2/VO2).7)
Statistical analysis
Data analysis was performed using SPSS 12.0K statistic package (SPSS Inc, Chicago, IL, USA). Cardiopulmonary continuous variables were compared among the groups by using one-way ANOVA and multiple comparisons were performed using the Tukey test. All data were expressed as the mean±standard deviation. A p of <0.05 was considered statistically significant for all analyses.
Results
General characteristics of the patients
All patients were asymptomatic except 1 patient with TOF who experienced intermittent chest pain. Among 48 patients, 40 were graded as NYHA class I. Only 8 patients were graded as NYHA class II, 6 of whom had undergone Fontan operation. As evaluated by the body surface area, physical growth was more delayed in the Fontan operation group than in the other groups (1.2±0.3 versus 1.26-1.42 m2, p=0.244). Progressive exercise time was the longest in the correction for simple CHD group than in the other groups (10.6±2 versus 8.2-8.7 minutes, p=0.122).
Cardiovascular and ventilatory responses
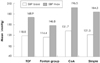
Cardiovascular and ventilatory responses to the exercise are presented in Table 3. The heart rate response to peak exercise was decreased in the Fontan operation group (p=0.062). Compared to the other groups, the CoA repair group exhibited a prominent blood pressure response, that is, an elevation in the SBP at rest and peak exercise (Fig. 1). Among the patients in the CoA repair group, 4 had undergone surgery at the age of 1 year. These 4 patients showed a higher SBP at peak exercise than the patients who were operated during infancy (227 versus 159 mmHg, respectively), and 3 of them were receiving antihypertensive medications. The predicted peak O2 pulse was the lowest in the Fontan operation group (p=0.057). Ventilatory responses to exercise were not significantly different among the groups. All the patients exhibited a sinus rhythm at the commencement of the exercise test. With progressive exercise, 8 patients showed intermittent premature ventricular contractions. One patient in the CoA repair group experienced monomorphic ventricular tachycardia at peak exercise that was converted to normal sinus rhythm spontaneously after exercise termination.
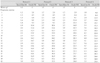
Measurement of metabolic and pulmonary gas exchanges
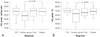
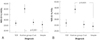
The values of metabolic and pulmonary gas exchanges during the exercise are presented in Table 4. The absolute and predicted values of mean peak VO2 were the lowest in the Fontan operation group (p=0.220 and 0.091, respectively; Fig. 2); however, the mean VO2 at AT was almost identical among the groups (p=0.917). Interestingly, in TOF patients with pulmonary valve replacement (PVR; n=2) performed due to significant pulmonary regurgitation, the absolute peak VO2 was higher than in the patients (n=9) who had undergone only TOF total correction (38.5 versus 32.9 mL·kg-1·minute-1, respectively). This finding correlated with the progressive exercise time taken by the 2 patients with PVR and the 9 patients with only TOF total correction (11.6 versus 7.8 minutes, respectively). The increase in the ventilatory equivalents for CO2 (VE/VCO2) and O2 (VE/O2) at peak exercise was significantly greater in the Fontan operation group than in the other groups (p<0.001 for both; Fig. 3). The pulse oximeter demonstrated a significantly greater decrease in the values in the Fontan operation group than in the other groups at rest and, in particular, at peak exercise (p<0.001 for both; Fig. 4). Among the 12 patients in the Fontan operation group, 4 patients had a fenestration between the Fontan pathway and the common atrium. At the resting state, no significant difference in pulse oximeter findings was observed between patients with and without the fenestration (87% versus 86%). At peak exercise, however, the pulse oximeter showed relatively lower values in patients with the fenestration than in those without the fenestration (79% versus 83.5%).
Discussion
Since the 1960s,8) CPET, with its expanded applications to many cardiac and respiratory diseases, has been used to objectively evaluate the exercise capacity in patients with chronic heart failure (CHF). Weber et al.9) shed light on the clinical evaluation of gas exchange responses to exercise from a cardiologist's perspective. However, its applications were mainly confined to research purposes and evaluation of interventions in CHF until the 1990s.10) Since then, CPET has been widely used to evaluate heart transplantation candidates for heart failure and to investigate its clinical course in CHD patients with a previous Fontan operation, right ventricular outflow tract reconstruction, etc.5)11)
Maximal VO2, which is achieved at maximal exercise, is well known as one of the best indicators of exercise capacity. At maximal exercise, there is no further increase in O2 uptake because a maximal VO2 has already been reached.12) However, because up to 50% of untrained children cannot attain the plateau of O2 uptake, the use of maximal VO2 as exercise capacity is not acceptable in children. Instead, peak O2 uptake (peak VO2) has been reported to be a more applicable indicator of exercise capacity in children.13) In this study, the mean peak VO2 was the lowest (29.4±7.7 mL·kg-1·minute-1, 59.3% of predicted peak VO2) in the Fontan operation group, although it was not significant in comparison with the corresponding values in the other groups (Fig. 2). The peak VO2 in patients with a previous Fontan operation ranges from 14.8 to 33.8 mL·kg-1·minute-1 in previous studies, and this range is one-third to nine-tenth of the normal values.14) This finding indicates that exercise capacity is the lowest in patients with a previous Fontan operation. In reality, half of the patients in the Fontan operation group in this study had NYHA functional class II. Diller et al.15) have demonstrated that peak VO2 decreases as the NYHA class increases in adult patients with CHD. In another study, the mean peak VO2 was relatively lower in the patient groups than the normal values in healthy children.6) When we consider only the RER of all groups at peak exercise, the subjects appeared to perform exercise at their maximum capacity. RER at peak exercise is usually used as an index of the performance of peak exercise. A peak RER value of less than 1.1 indicates that subjects have performed exercise submaximally.16) In this study, a low peak VO2 in patients in the TOF, CoA, and control groups can be explained as follows: First, the subjects might have been relatively unconditioned because of hypoactivity due to the postoperative fear for exercise or residual hemodynamic problems. Second, the subjects might have stopped progressive exercise too early during the test due to the lack of experience of the physicians and laboratory technicians who conducted the test, and this probably led to a value that does not reflect the true value of peak VO2. Nonetheless, we found decreased exercise capacity in patients who had undergone surgeries for CHD, a finding that has not been reported previously.
Cardiac output (CO) increases with exercise due to the increasing metabolic need of tissues. CO increase is determined by both stroke volume and heart rate increase during initial exercise, but exclusively by increasing heart rate during moderate or rigorous exercise.17) Oxygen pulse has been used as an estimator of stroke volume in CPET.6) In the Fontan operation group in this study, the absolute and predicted values of mean O2 pulses were the lowest (p=0.057 and 0.010, respectively); this indicates a decreased stroke volume. However, the peak heart rate responses during exercise were lower in this group than in the other groups (p=0.062), suggesting chronotropic insufficiency because of impaired cardiac autonomic nervous activity after operation and intrinsic or secondary sinus nodal dysfunction.14) In the event, CO is low at rest and lower at peak exercise in patients with a previous Fontan operation. The peak CO was reported to be approximately half the normal values in a previous study.18) These findings suggest that patients with a previous Fontan operation have persistent ventricular dysfunction although they are asymptomatic.
Blood pressure responses to exercise afford much information about subjects' hemodynamic status and intrinsic problems. In general, SBP rises progressively with an increase in work rate and VO2 because the systemic vascular resistance decreases. Abnormal blood pressure responses include a reduction in the SBP increase, excessive increase, or a decrease.7) In this study, we noticed 2 important blood pressure responses to exercise. First, the SBP was markedly elevated in the CoA patients after surgery. Among the 11 patients who had undergone repair for CoA, 3 patients exhibited SBP greater than 230 mmHg at peak exercise. In addition, all these 3 patients had undergone a corrective surgery after 1 year of age. Exercise-induced systolic hypertension in successfully corrected CoA patients and its relationship with morbidity and mortality are well known. Elevated SBP is mainly attributed to persistent impaired elastic properties of the ascending aorta characterized by increased stiffness and decreased distensibility.19) Second, the peak SBP responses in the Fontan operation group were relatively lower than those in the other groups. Arterial blood pressure is relatively well maintained partly due to increased systemic vascular resistance up to moderate exercise. However, at peak exercise, the SBP is usually lower in patients with a previous Fontan operation than in healthy subjects because of a relatively decreased CO.14) Ohuchi et al.20) have demonstrated that impaired ventricular systolic function and low body weight are the major determinants of lowered peak SBP.
In the Fontan operation group, ventilatory changes during exercise were prominent in terms of the ventilatory equivalents for CO2 (VE/VCO2) and O2 (VE/O2) at peak exercise. VE/VCO2 and VE/VO2 were significantly more elevated at peak exercise in this group than in the other groups (p<0.001 for both; Fig. 3), indicating that patients with a previous Fontan operation have pathophysiologic features similar to those of patients with CHF.14) There are several explanations for the abovementioned findings. The VE/VCO2 increase is well correlated with dead space increase. In the Fontan operation group, the main mechanism of increased dead space due to the imbalance between ventilation and perfusion is the scarcity of subpulmonic ventricle.14) In addition, compared to the other groups, this group demonstrated significantly greater arterial O2 desaturation at peak exercise (p<0.001; Fig. 4); this directly increases the VE, subsequently resulting in a strong relationship between VE and CO2 production.21)
Many patients who undergo a corrective surgery for CHD have changes similar to those in normal subjects who experience an unconditioned state characterized by muscular atrophy and decrease in muscle strength. Some patients with decreased exercise capacity might be concerned about exercise. Although there is little data on safety and efficacy of exercise training in CHD patients, these studies have concluded that exercise training is safe22) and effective.23) In this regard, CPET is helpful in convincing the patients and their parents of the safety of exercise and in observing the responses to exercise training.24) Physicians have an additional role to play in appropriate exercise training using CPET in the case of patients who undergo a surgery for CHD.
In conclusion, CPET is a useful tool to investigate exercise capacity and to reflect hemodynamic status of the patients who have various CHDs or acquired heart diseases. CPET enables the patients and their parents to familiarize with exercise, and it helps them with exercise training. Thus, CPET can help patients live through their childhood and adolescence like other healthy children and adolescents.
Limitations of this study
The major limitation of this study is that each group did not represent the entire range of diseases. This is because the number of patients in each group was relatively small, and most patients belonged to a relatively good NYHA class, although there was a wide range of NYHA classes within each group. We did not assess the ventricular function of all the patients by echocardiography because it was difficult to compare the ventricular function among groups considering the heterogenous disease entities. However, the description of the ventricular function aspect would be inevitable when exercise capacity is compared in a single-disease group. In addition, we selected subjects with simple CHDs who had undergone early corrective surgery as controls; however, these patients may not reveal normal values of healthy subjects. Unfortunately, we do not have data of the normal values for Korean children and adolescents. Further studies are required to determine the normal values of CPET in Korean children and adolescents.


 XML Download