

 PDF
PDF ePub
ePub Citation
 Print
Print


Abstract
Purpose:
This study was conducted to analyze recent trends and causes of maternal mortality in Korea between 2009 and 2014.
Methods:
We investigated trends and causes of maternal death using the data from Complementary Investigations on the Infant, Maternal, and Perinatal Mortality carried out by Statistics Korea between 2009 and 2014. Maternal age, administrative district, causes of death and gestational age at the time of death were collected from data. Statistics including maternal mortality ratio (MMR) and maternal mortality rate were calculated. We also analyzed MMR according to the age, and administrative districts. The causes of maternal death were sorted and classified using International Classification of Diseases and World Health Organization recommendations.
Results:
The average MMR during 6 years was 13.16 and maternal mortality rate was 0.45. MMR was highest in 2011 (17.2) and lowest in 2012 (9.9). The average MMR of the administrative districts varied greatly from 7.51 (Gwangju) to 26.84 (Jeju). The average MMR during the study period was lowest in maternal age of 2024 (6.9), and highest in 45-49 (143.7). On average, direct and indirect maternal deaths accounted for 66.2% and 29.9% of total maternal death, respectively. The three most common causes of maternal deaths were obstetrical embolism (24.4%), postpartum hemorrhage (18.3%), and hypertensive disease of pregnancy (5.5%) in decreasing order of frequency.
Conclusion:
Although MMR is decreasing during the study period, it fluctuates widely according to maternal age, districts, and constant effort for improvements is necessary. To reduce maternal deaths, solution to control preventable causes of maternal deaths, careful management of pregnancies with advanced maternal age, and policy to solve the discrepancy in the medical services among diverse regions in the country are needed.
Go to : 
REFERENCES
1). Chung SH., Choi YS., Bae CW. Definitions of terminology in perinatal epidemiology and recommendations for grouping in statistics: by definition of ICD 10th revision (WHO) and NVSR (CDC, USA). Korean J Perinatol. 2011. 22:161–8.
2). WHO. Millenium development goals. [cited 2016 March 1]; Available from:. http://www.who.int/topics/millennium_development_goals/about/en/.
3). WHO. ICD-10 Application to deaths during pregnancy, childbirth and the puerperium. 2012. 77.
4). Ministry of Health and Welfare. Health Plan 2010 - Comprehensive Plan for National Health Promotion. 2005.
5). Choi JS., Seo K., Lee NH., Kim SY., Lee SU., Lee SU, et al. Infant and maternal death survey report in 2007-2008. Seoul: Korea Ministry of Health and Welfare, Korea Institute for Health and Social Affairs, Korean Medical Record Association;2010.
6). Statistics Korea. Complementary Investigations on the Infant, Maternal, and Perinatal Mortality. [cited 2016 March 1]; Available from:. https://mdis.kostat.go.kr/extract/extSurvSearchByDate.do?extcTypeDivCD=E&curMenuNo=UI_POR_P1070.
7). Statistics Korea. Annual number of births of Korea. [cited 2016 March 1]; Available from:. https://mdis.kostat.go.kr/extract/extSurvSearchByDate.do?extcTypeDivCD=E&curMenuNo=UI_POR_P1070.
8). Statistics Korea. Mid-year population of registered Korean residents. [cited 2016 March 1]; Available from:. http://kosis.kr/statisticsList/statisticsList_01List.jsp?vwcd=MT_ZTITLE&parentId=A.
9). United Nations (UN). The Millennium Development Goals Report 2015. New York. 2015.
10). OECD. Health/Health status/Maternal and infant mortality. [cited 2016 March 1]; Available from:. http://stats.oecd.org/.
11). Park YW., Lee JJ. Overview of obstetrics. Korean Society of Obstetrics and Gynecology. editor.Obstetrics. 5th ed.Seoul: Koonja Publishing Inc.;2015. p. 6–11.
12). Cantwell R., Clutton-Brock T., Cooper G., Dawson A., Drife J., Garrod D, et al. Saving mothers' lives: reviewing maternal deaths to make motherhood safer: 2006-2008. The Eighth Report of the Confidential Enquiries into Maternal Deaths in the United Kingdom. BJOG. 2011. 118(Suppl 1):1–203.
13). Creanga AA., Berg CJ., Syverson C., Seed K., Bruce FC., Callaghan WM. Pregnancy-related mortality in the United States, 2006-2010. Obstet Gynecol. 2015. 125:5–12.

14). Nagaya K., Fetters MD., Ishikawa M., Kubo T., Koyanagi T., Saito Y, et al. Causes of maternal mortality in Japan. JAMA. 2000. 283:2661–7.
15). Clark SL., Belfort MA., Dildy GA., Herbst MA., Meyers JA., Hankins GD. Maternal death in the 21st century: causes, prevention, and relationship to cesarean delivery. Am J Obstet Gynecol. 2008. 199: 36:e1–5.
16). Say L., Chou D., Gemmill A., Tuncalp O., Moller AB., Daniels J, et al. Global causes of maternal death: a WHO systematic analysis. Lancet Glob Health. 2014. 2:e323–33.
17). Kassebaum NJ., Bertozzi-Villa A., Coggeshall MS., Shackelford KA., Steiner C., Heuton KR, et al. Global, regional, and national levels and causes of maternal mortality during 1990-2013: a systematic analysis for the Global Burden of Disease Study 2013. Lancet. 2014. 384:980–1004.
Go to :
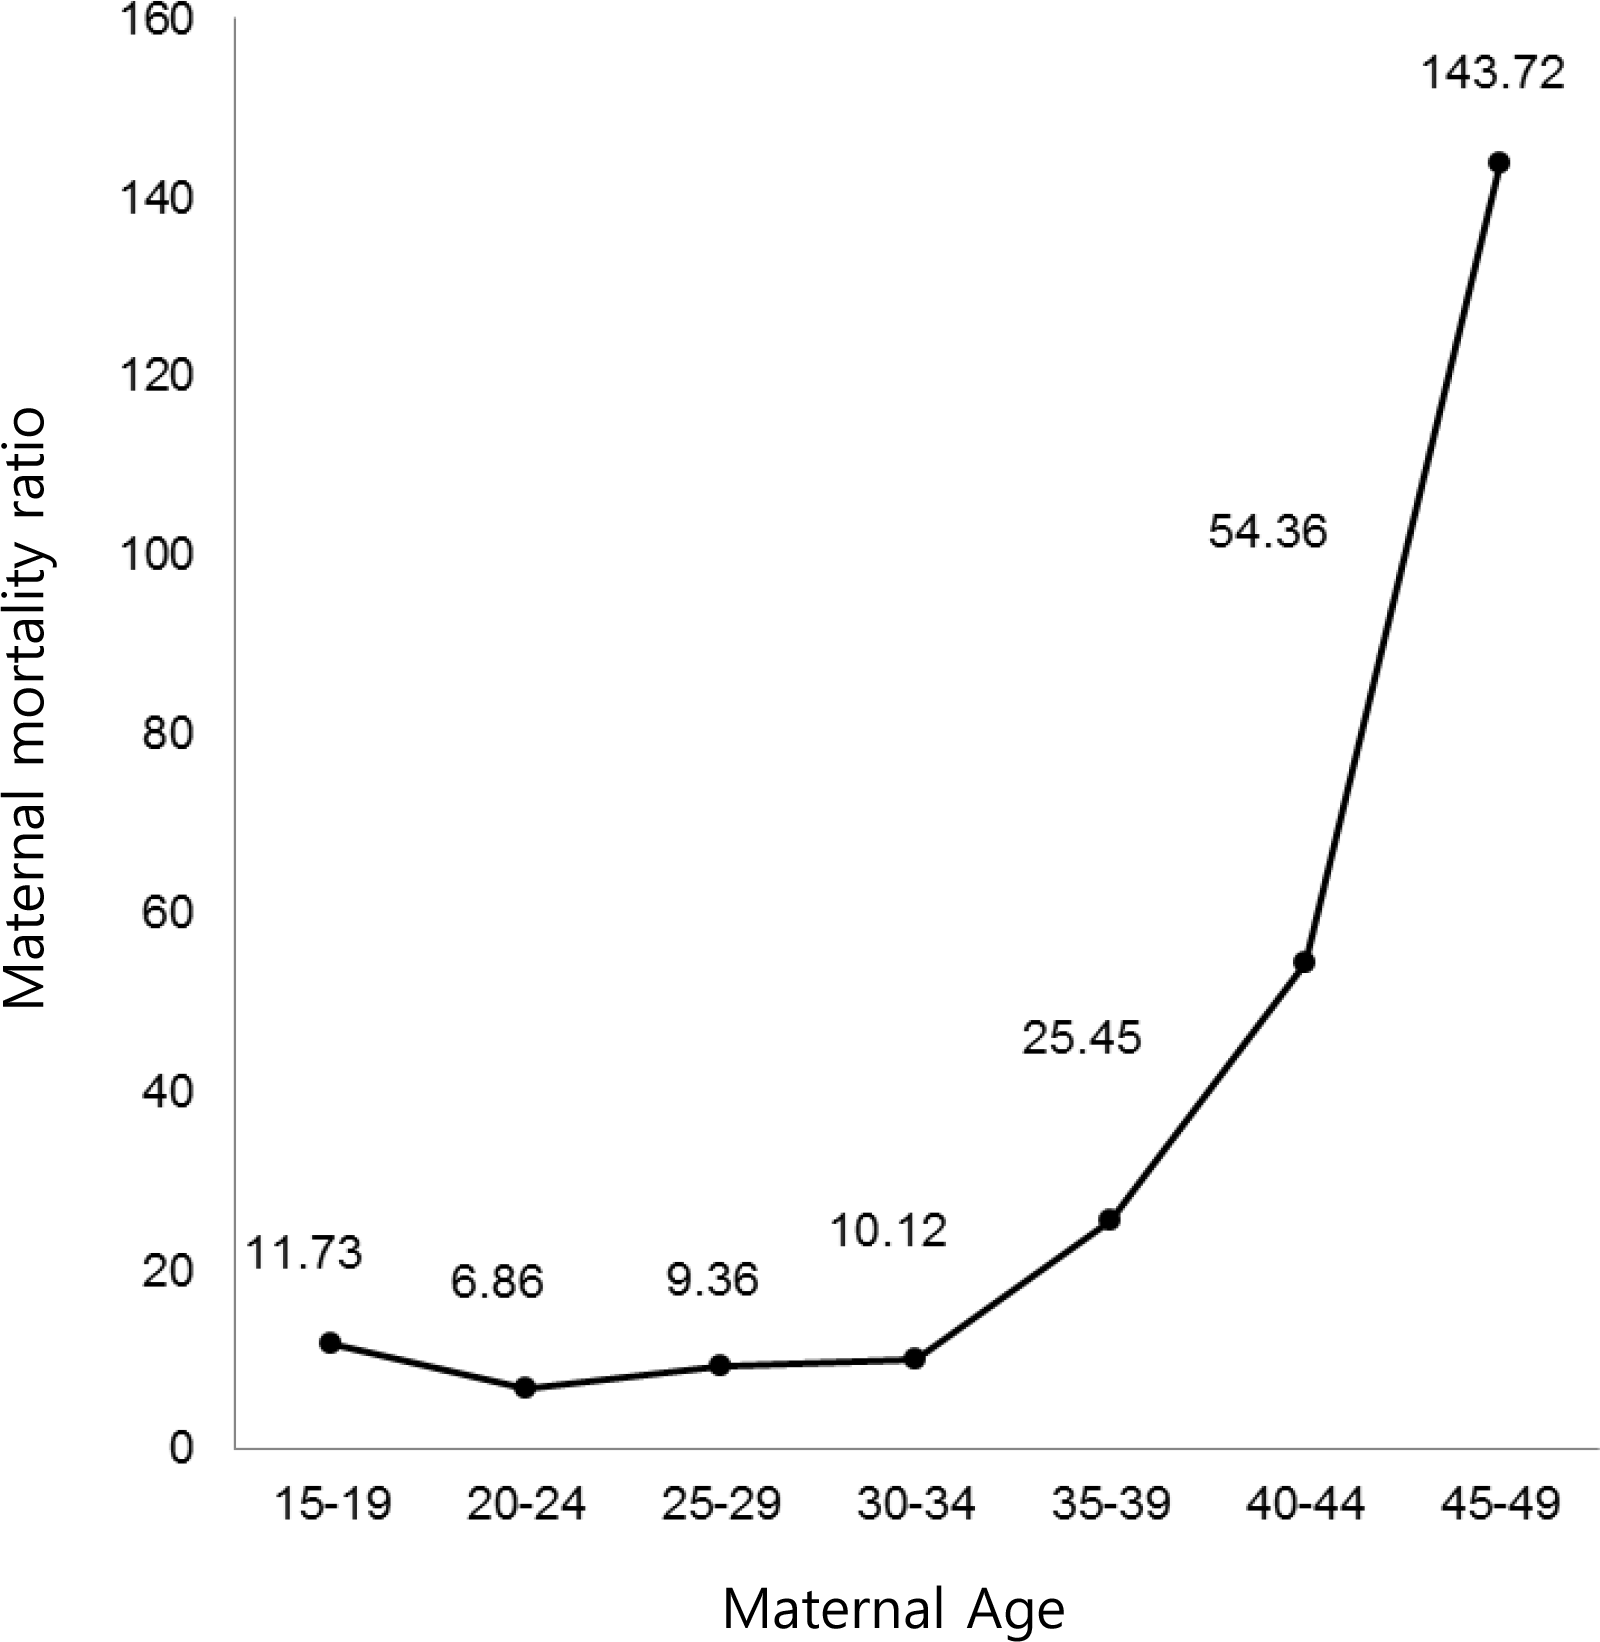
Table 1.
Annual Number of Maternal Deaths, Maternal Mortality Ratio, and Maternal Mortality Rate
Table 2.
Maternal Mortality Ratio According to the Districts of Korea (2009-2014)
Table 3.
Common Causes of Maternal Deaths during 2009-2014
Table 4.
Grouping of Maternal Deaths According to WHO Recommendation
 XML Download