Abstract
Purpose :
The purpose of this study was to determine if timing of enterostomy repair described in terms of postmenstrual age (PMA) could influence postoperative course, complications, and growth.
Methods :
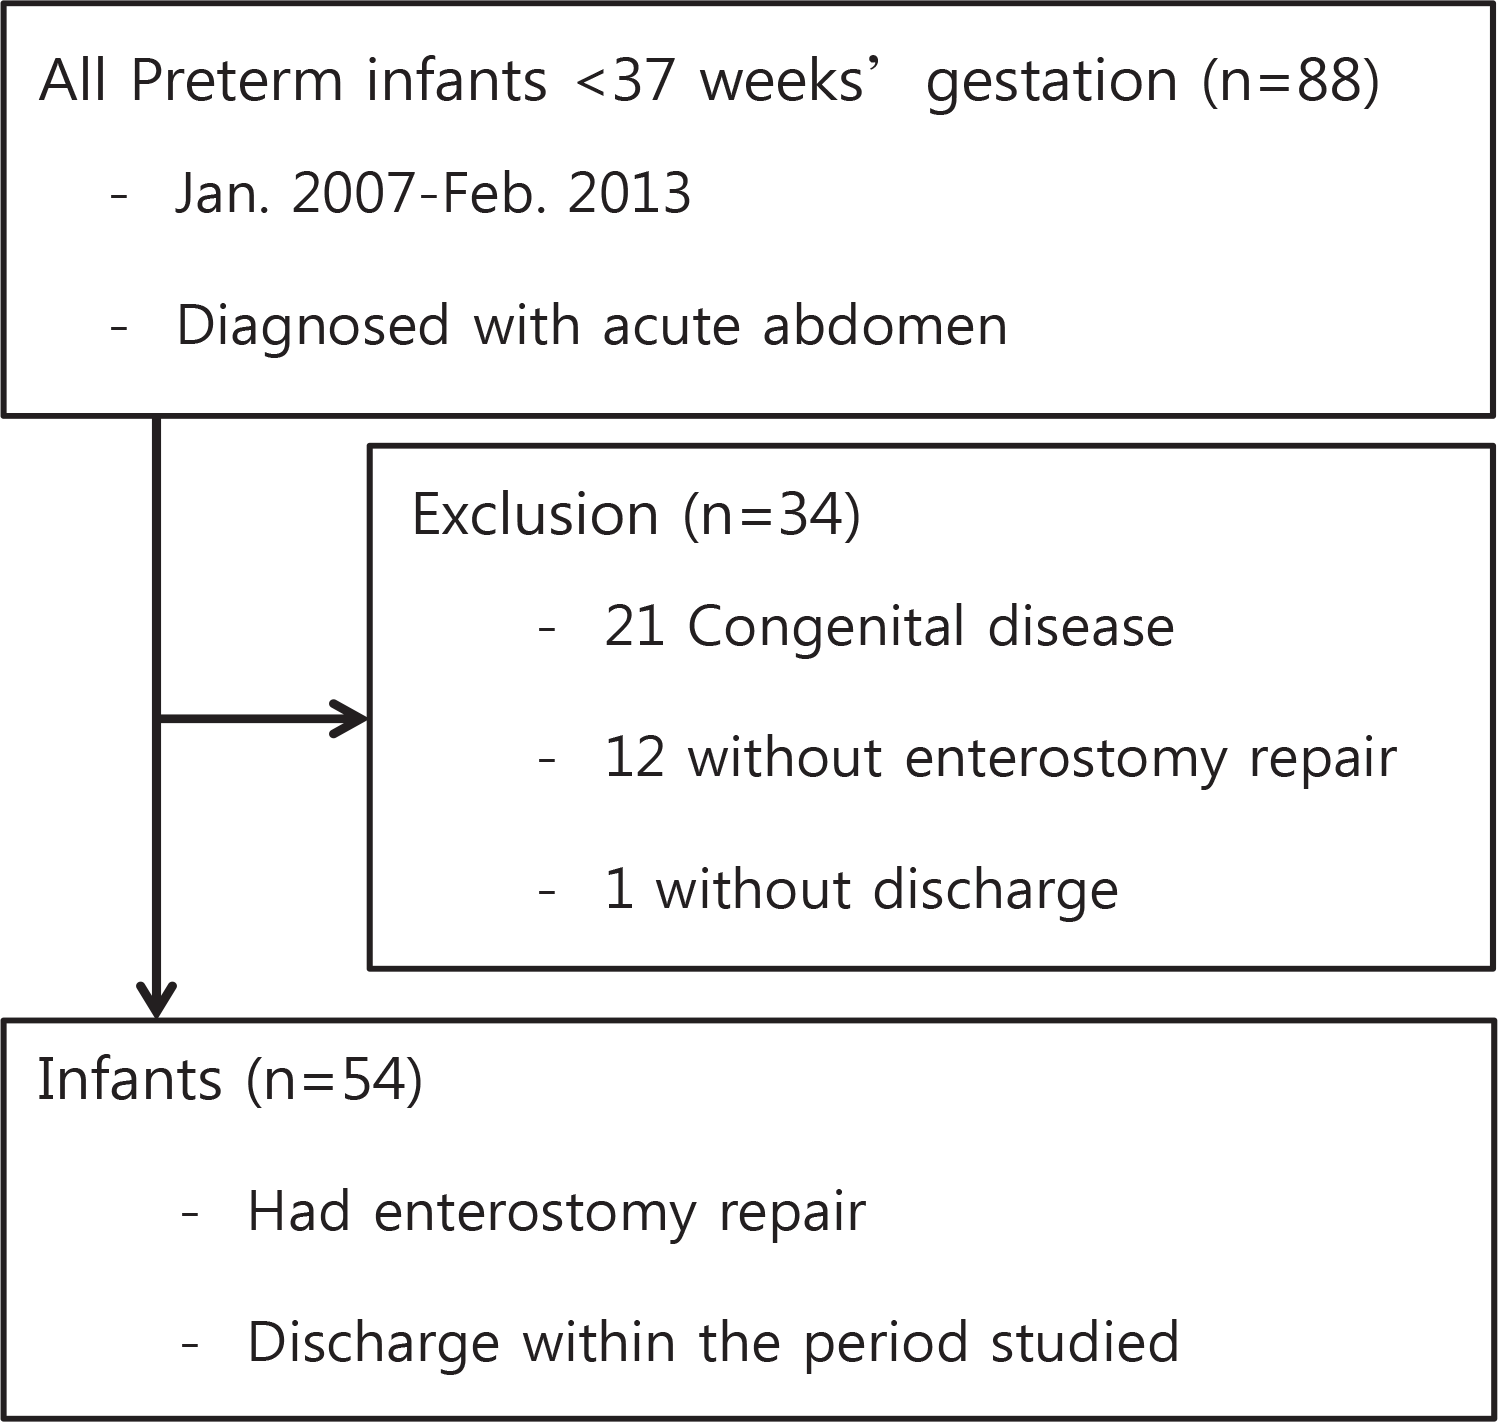
Under the Institutional Review Board approval, records of preterm infants who underwent enterostomy and subsequent repair from 2007 to 2013 at Seoul national university children's hospital were reviewed. Records of infants with congenital anomalies were excluded. Data collected included baseline characteristics, PMA, weight at enterostomy and enterostomy repair, postoperative course, enterostomy repair-related complications, and follow-up growth after repair. For analysis, patients were divided into 2 groups: group 1 with enterostomy repaired before PMA 40 weeks; and group 2 with enterostomy repaired since PMA 40 weeks.
Results :
There were 54 infants: 16 in group 1 and 38 in group 2. The median weight at the time of enterostomy repair was greater in group 2 compared to those of group 1. Group 1 infants had more complications and had to be ventilated longer after enterostomy repair. They required longer periods of total parenteral nutrition and took longer to reach full enteral feeding. Group 1 infants also needed longer hospital stay after enterostomy repair. No statistical difference was observed in growth after discharge.
REFERENCES
1). Goldenberg RL., Culhane JF., Iams JD., Romero R. Epidemiology and causes of preterm birth. Lancet. 2008. 371:75–84.

2). Moon JY., Hahn WH., Shim KS., Chang JY., Bae CW. Changes of maternal age distribution in live births and incidence of low birth weight infants in advanced maternal age group in Korea. Korean J Perinatol. 2011. 22:30–6.
3). Han DH., Lee KS., Chung SH., Choi YS., Hahn WH., Chang JY, et al. Decreasing pattern in perinatal mortality rates in Korea: In comparison with OECD nations. Korean J Perinatol. 2011. 22:209–20.
4). Tin W., Wariyar U., Hey E. Changing prognosis for babies of less than 28 weeks' gestation in the north of England between 1983 and 1994. Northern Neonatal Network. BMJ. 1997. 314:107–11.
5). Draper ES., Manktelow B., Field DJ., James D. Prediction of survival for preterm births by weight and gestational age: retrospective population based study. BMJ. 1999. 319:1093–7.

6). Stoelhorst GM., Rijken M., Martens SE., Brand R., den Ouden AL., Wit JM, et al. Changes in neonatology: comparison of two cohorts of very preterm infants (gestational age <32 weeks): the Project On Preterm and Small for Gestational Age Infants 1983 and the Leiden Follow-Up Project on Prematurity 1996-1997. Pediatrics. 2005. 115:396–405.

7). Saigal S., Doyle LW. An overview of mortality and sequelae of preterm birth from infancy to adulthood. Lancet. 2008. 371:261–9.

8). Khashu M., Narayanan M., Bhargava S., Osiovich H. Perinatal outcomes associated with preterm birth at 33 to 36 weeks' gestation: a population-based cohort study. Pediatrics. 2009. 123:109–13.

9). Rocha G., Costa C., Correia-Pinto J., Monteiro J., Guimaraes H. The acute abdomen in the newborn. Acta Med Port. 2009. 22:559–66.
10). Struijs MC., Sloots CE., Hop WC., Tibboel D., Wijnen RM. The timing of ostomy closure in infants with necrotizing enterocolitis: a systematic review. Pediatr Surg Int. 2012. 28:66772.

11). Gertler JP., Seashore JH., Touloukian RJ. Early ileostomy closure in necrotizing enterocolitis. J Pediatr Surg. 1987. 22:140–3.

12). Musemeche CA., Kosloske AM., Ricketts RR. Enterostomy in necrotizing enterocolitis: an analysis of techniques and timing of closure. J Pediatr Surg. 1987. 22:479–83.

13). Rothstein FC., Halpin TC Jr., Kliegman RJ., Izant RJ Jr. Importance of early ileostomy closure to prevent chronic salt and water losses after necrotizing enterocolitis. Pediatrics. 1982. 70:249–53.

14). Al-Hudhaif J., Phillips S., Gholum S., Puligandla PP., Flageole H. The timing of enterostomy reversal after necrotizing enterocolitis. J Pediatr Surg. 2009. 44:924–7.

15). O'Neill JA Jr., Holcomb GW Jr. Surgical experience with neonatal necrotizing enterocolitis (NNE). Ann Surg. 1979. 189:612–9.
16). Aguilar Cuesta R., Barrena Delfa S., Hernandez Oliveros F., Lassaletta Garbayo L., Tovar Larrucea JA. When is it best to perform enterostomy closure in premature infants with necrotizing enterocolitis? Cir Pediatr. 2011. 24:109–11.
17). Kinouchi K. Anaesthetic considerations for the management of very low and extremely low birth weight infants. Best pract Res Clin Anaesthesiol. 2004. 18:273–90.

18). Holzman RS. Morbidity and mortality in pediatric anesthesia. Pediatr Clin North Am. 1994. 41:239–56.

19). Rappaport B., Mellon RD., Simone A., Woodcock J. Defining safe use of anesthesia in children. N Engl J Med. 2011. 364:1387–90.

20). Shin HC., Moon SB., Lee SC., Jung SE., Park KW. Experience with Enterostomy Closure in Very Low Birth Weight Infants. J Kor Assoc Pediatr Surg. 2009. 15:18–26.

21). Koivusalo A., Pakarinen M., Lindahl H., Rintala RJ. Preoperative distal loop contrast radiograph before closure of an enterostomy in paediatric surgical patients. How much does it affect the procedure or predict early postoperative complications? Pediatr Surg Int. 2007. 23:747–53.
22). Radhakrishnan J., Blechman G., Shrader C., Patel MK., Mangurten HH., McFadden JC. Colonic strictures following successful medical management of necrotizing enterocolitis: a prospective study evaluating early gastrointestinal contrast studies. J Pediatr Surg. 1991. 26:1043–6.

23). Born M., Holgersen LO., Shahrivar F., Stanley-Brown E., Hilfer C. Routine contrast enemas for diagnosing and managing strictures following nonoperative treatment of necrotizing enterocolitis. J Pediatr Surg. 1985. 20:461–3.

Table 1.
Comparison of Baseline Characteristics between Two Groups
Table 2.
Comparison Related to Enterostomy between Two Groups
Abbreviations : E, enterostomy; ER, enterostomy repair; NEC, necrotizing enterocolitis; SIP, spontaneous intestinal perforation; MPS, meconium plug syndrome; TPN, total parenteral nutrition Values are expressed as median and ranges in parentheses or numbers of individuals with percentages in parentheses (%)
Table 3.
Comparison Related to Enterostomy Repair between Two Groups
Table 4.
Complication Related to Enterostomy Repair
Table 5.
Follow Up Growth Comparison of the Two Groups


 PDF
PDF ePub
ePub Citation
 Print
Print


 XML Download