

 PDF
PDF ePub
ePub Citation
 Print
Print


Abstract
Purpose
Materials and Methods
Results
Conclusion
Figures and Tables
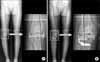 | Fig. 1(A) The mechanical axis % (MA%) shown on the preoperative ortho-roentgenogram is evaluated by percentile denotation [(b/a)×100]. "a" is the width of tibia plateau and "b" is the distance from the medial border of the medial tibial condyle to the point at which the mechanical axis intersects the knee joint line. It shows medial deviation of the mechanical axis. (B) The mechanical axis % (MA%) shown on the postoperative ortho-roentgenogram is evaluated by percentile denotation [(b'/a')×100]. "a'" is the width of tibia plateau and "b'" is the distance from the medial border of the medial tibial condyle to the point at which the mechanical axis intersects the knee joint line. It shows lateral deviation of the mechanical axis.
|
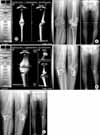 | Fig. 2Change of mechanical axis after the open wedge high tibial osteotomy using navigation system. (A) A 64-year-old woman have the open wedge high tibial osteotomy under navigation control. In the preoperative roentgenogram, the mechanical axis (MA) is varus 9.4° and the mechanical axis % (MA%) is 9.2%. The posterior slope angle of tibia is 8.0°. In the navigation system, the MA is varus 7.4° and the MA% is 22%. (B) In the navigation system, the post-osteotomy MA is valgus 3.5° and the MA% is 57.7%. In the postoperative 2 week roentgenogram, the MA is valgus 5.2° and the MA% is 72.9%. The posterior slope angle of tibia is 12.1°. The postoperative MA and MA% in roentgenogram is larger than the postosteotomy MA and MA% in navigation system. (C) In the postoperative 4 month roentgenogram, the MA is varus 1.2° and the MA% is 37.4%. There are two proximal screws breakage of Puddu plate and loss of correction angle.
|
Table 1

*MA, angle between the femoral and tibial mechanical axis; †MA%, percentile denotation ((b/a)×100) of the point at which the mechanical axis of the low extremity intersects the line extending from the medial border to the lateral border of the tibial plateau on orthoroentgenogram; ‡-, negative values mean varus angles.
![]()
Table 2
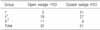
*Group I, Group of cases in which the postoperative mechanical axis on radiograph is 2° smaller than the post-osteotomy mechanical axis on navigation; †Group II, Group of cases in which the difference between the postoperative mechanical axis on radiograph and post-osteotomy mechanical axis on navigation is within 2°; ‡Group III, Group of cases in which the postoperative mechanical axis on radiograph is 2° more than the post-osteotomy mechanical axis on navigation.
![]()
 XML Download