

 PDF
PDF ePub
ePub Citation
 Print
Print


INTRODUCTION
The determination of cerebral hemodynamic status and tissue viability is crucial for therapeutic applications in acute ischemic stroke. In the acute phase of ischemic stroke, diffusion-weighted imaging (DWI) and perfusion-weighted imaging (PWI) have been used to define which hypoperfused areas are at a potential risk for infarction. Recently, susceptibility-weighted imaging (SWI) has been found to be a useful imaging sequence in the assessment of acute stroke. SWI uses local tissue susceptibilities, such as iron deposition and blood oxygenation level dependent (BOLD) effect, to make contrast between different tissues (1). A relative increase in deoxyhemoglobin levels in hypoperfused tissue can cause prominent hypointense signals in the draining veins (PHSV) within areas of impaired perfusion in SWI (2, 3). It has been suggested that the prominence of these veins is related to an increased oxygen extraction fraction (OEF) in the penumbra of the infarct (2, 3). There were several attempts to assess oxygen saturation or oxygen extraction fraction in quantitative methods using SWI (4, 5, 6), however, no investigational studies have been performed to validate SWI for the assessment of hemodynamic alterations following stroke.
The purpose of this study is to evaluate the usefulness of SWI in patients with acute cerebral infarction by evaluating PHSV within areas of impaired perfusion and to investigate the usefulness of PHSV in predicting prognosis of cerebral infarction.
MATERIALS AND METHODS
This study was approved by the local ethics committee of our institution. Because of the retrospective nature of this study, informed consent was waived.
Patient selection
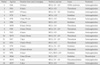
From March 2009 through February 2013, patients with acute cerebral infarction who underwent brain MRI with both DWI and SWI within 24 hours after ictus in our institution were retrospectively evaluated. Patients with territorial lobar infarctions in the anterior and/or middle cerebral artery territories based on DWI were included in the study, but those with lacunar infarction less than 1 cm in diameter were excluded. A total of 37 patients fulfilled the eligibility criteria and were selected for the study. The follow-up brain MRI or CT examinations, ranging from one day to 27 days after initial brain MRI were available in 18 (seven men and eleven women; age range, 51 to 90 years; mean age, 72.4 ± 11.6 years) of the 37 patients, and these patients were finally included in the study to assess the change in the extent of cerebral infarction on follow-up brain imaging. The mean NIHSS score for these patient was 13 (range, 3 to 20) and the total follow-up periods were varied from 2 weeks to 60 months (mean period, 22.9 ± 23.9 months).
MRI protocol
All patients underwent MR imaging on a 3-Tesla superconducting MRI system (Verio; Siemens, Erlangen, Germany). The MR imaging protocol included an SWI sequence in addition to routine sequences such as T1, T2, FLAIR, and DWI sequences. The MRI parameters were as follows: T1-weighted image (TR/TE, 477/9.4; flip angle, 70°; slice thickness, 5 mm; matrix size, 230 × 230, number of axial slices, 28; number of excitations, 1; acquisition time, 1 min 48 sec); T2-weighted image (TR/TE, 5740/95; flip angle, 150°; slice thickness, 5 mm; matrix size, 230 × 230, number of axial slices, 28; number of excitations, 1; acquisition time, 1 min 57 sec); FLAIR image (TR/TE, 9000/86; flip angle, 150°; slice thickness, 5 mm; matrix size, 230 × 230, number of axial slices, 28; number of excitations, 1; acquisition time, 1 min 48 sec); diffusion-weighted image (b=0, 1000 s/mm2, TR/TE, 7000/106; flip angle, 90°; slice thickness, 5 mm; 106 × 106 spatial resolution for a 220 × 220 mm FOV); susceptibility-weighted image (TR/TE, 27/20; flip angle, 15°; slice thickness, 2 mm; matrix size, 256 × 182, number of axial slices, 72; number of excitations, 1; acquisition time, 5 min 5sec). SWI post-processing was performed, and 16 thick minimum intensity projection (mIP) slabs were generated.
Imaging analysis
PHSV was defined as hypointense signal intensities of draining veins compared with those of draining veins in contralateral normal hemisphere. First, we assessed the presence of PHSV qualitatively and localize the PHSV on initial SWI. Locations of PHSV were classified as periphery and core. The core PHSV was defined as the infarcted area per se on DWI where the high signal intensity was present, and the peripheral PHSV was defined as the adjacent and contiguous area outside the infarcted area on DWI.
We graded the degree of hypointensity of peripheral PHSV visually (-: no dark signal intensity vessels within or adjacent to the infarction, +: symmetric to the contralateral side, dark signal intensity vessels within or adjacent to the infarction, ++: a few asymmetric to the contralateral side, marked dark signal intensity vessels within or adjacent to the infarction, +++: grouped, asymmetric to the contralateral side, marked dark signal intensity vessels within or adjacent to the infarction). On visual assessment, we regarded significant peripheral PHSV as the degree of hypointensity of ++ or +++.
The progression of the extent of infarction was assessed on follow-up MR or CT images of the brain. Two radiologists (A.K.J; 18 years of experience, L.H.S; 4 years of experience) reviewed the initial and follow-up imaging findings, and determine the MRI or CT findings in consensus. Progression was defined as increase of more than 20% in the infarction area by multiplying anteroposterior diameter and transverse diameter of the largest infarction area on axial image. In addition, the relationships between the presence of peripheral or core PHSV in the initial SWI and the size of infarction on the initial MRI and the presence of hemorrhagic transformation in the follow-up imaging were evaluated.
Second, the PHSV was assessed semi-quantitatively using signal intensity difference on SWI. According to Yuri Zaitsu et al. (6), the change in oxygen extraction fraction (OEF) can be calculated by using two SW phase images, under the assumption of the vessel positions and angles are the same in these measurements of Δ φ, which means phase value difference between the vessel and the surrounding tissue. In case of the same vessel in two serial SWI, which has same position and angle to main magnetic field, the change of OEF(ΔOEF) is proportional to change in phase value difference(Δ φ1- Δ φ0, Δ φ0: baseline, Δ φ1: each condition). In practice, measuring of phase value on routine MR imaging is not easy, we measured the signal intensity of vessels on SWI which reflects phase value difference on phase map, and the contralateral cerebral hemisphere without infarct was considered as baseline control. To make the vessel orientation independent to main magnetic field, traversing vessels on axial image, in other words perpendicular to main magnetic field, were selected both side of cerebral hemispheres on the same axial SWI slice. Manually, a region of interest (ROI) was placed on the peripheral PHSV at infarction side and the ROI was copied, than placed on the adjacent brain tissue to get signal intensity difference in infarction side. Another ROI was drawn on traversing cortical vein in contralateral normal cerebral hemisphere and same manner as mentioned above. The control signal intensity difference was calculated. Using these two signal intensity difference in SWI on the same axial image, the signal intensity difference ratio was obtained.
The size of the ROIs was kept constant (3.23 mm2) to maintain consistency in signal intensity difference analysis and to avoid contamination of signal intensity value heterogeneity. Two experienced radiologists measured signal intensity values in consensus.
For statistical analysis, a Fisher's exact test was employed to evaluate the correlation between the presence of peripheral PHSV and various evaluating items (i.e., the progression of the extent of cerebral infarction, the presence of hemorrhagic transformation, and the cause and size of cerebral infarction). Wilcoxon rank sum test was used to compare signal intensity difference ratio between the progression and the group with little change. Significance was accepted at p < 0.05 for all tests. All statistical analyses were performed using statistical software (SPSS for Windows, version 18.0; SPSS, Chicago IL).
RESULTS
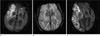
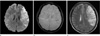
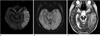
Of the 18 patients, there was no statistical difference between the infarction progression group and the group of little change in the distribution of sex (p=0.204) or patient age (p=0.454). Imaging time from the onset of symptoms varied from 1 hr 20 m to 7 days (Table 1). Only one patient was treated with intra-arterial and intravenous thrombolytic therapy; the others received anticoagulation therapy only. Of the 18 patients with acute cerebral infarction who underwent brain MRI with SWI and follow-up brain MRI or CT, 10 patients showed progression of the infarction, and 8 patients showed little change on follow-up imaging. Of the 10 patients with progression of the infarction, significant peripheral PHSV or significant peripheral with core PHSV was observed in 9 patients and these areas progressed to infarction in follow-up imaging (Fig. 1). The significant peripheral PHSV was not seen in only one patient with progression of infarction. On the other hand, the eight patients without progression of infarction did not show any significant peripheral PHSV (p=0.0001, Figs. 2 and 3) comparing to patients showing progression. The presence of PHSV at core of infarction did not influence on the further increase in the extent of infarction on follow-up imaging.
The relationship between the location of PHSV and the increase in the extent of infarction in follow-up imaging is shown in Table 2. Of the nine patients with significant peripheral PHSV or significant peripheral with core PHSV, two showed hemorrhagic transformation, and the patient with core PHSV only showed no hemorrhagic transformation. Of the nine patients without significant peripheral PHSV, no one showed hemorrhagic transformation. No significant relationship was found between the presence of peripheral PHSV and hemorrhagic transformation (p=0.98). No significant relationship was found between the presence of any type of PHSV and the size of the initial infarction (p=0.32).
In the progression group, mean signal intensity difference in the peripheral PHSVs (223.0 ± 148.7) showed 2.4 times higher than contralateral cerebral veins without infarction (92.6 ± 72.1). On the other hands, mean signal intensity difference in the peripheral PHSVs in group with little change (144.6 ± 155.1) showed 0.86 times higher than contralateral cerebral veins without infarction (167.5 ± 196.2). The signal intensity difference ratio measurement appeared statistically significant (p=0.006, Wilcoxon rank sum test) between the progression and the group with little change.
DISCUSSION
Predicting the prognosis of acute cerebral infarction remains difficult and most of the prognostic studies have been focused on the clinical risk factors and neurological assessments. The advancement in the MR technology such as DWI, PWI and MR angiography makes more accurate diagnosis of cerebral infarction. Using brain MRI, several efforts to predict prognosis of acute cerebral infarction was done (7, 8). In general, DWI lesions in patients who have undergone spontaneous recannalization do not increase in size, whereas in patients with a persisting arterial occlusion and an ischemic penumbra (DWI-PWI mismatch) further increases in the volume of infarction may occur (8). Saunders et al. reported that the infarction volume in initial MRI is useful tool in assessing prognosis (7), but no established imaging criteria or finding for predicting disease course of acute infarction to the best of our knowledge.
Recently, SWI has been emerged as a new imaging tool in the assessment of acute stroke. This sequence is sensitive to paramagnetic substances, such as deoxygenated blood, hemosiderin, ferritin and calcium (9). When the concentration of deoxyhemoglobin increases, a decrease in T2 and T2* is anticipated because of the signal dephasing phenomenon, which results in a decrease in signal intensity on both T2- and T2*-weighted images. Thus, BOLD effects can be used to monitor the changes in oxygen saturation in vivo under hypoxic condition. Transient PHSV has also been observed during the aura phase in some patients with migraine (10). The area of the PHSV has been found to be in agreement with the area of hypoperfusion in PWI. The vascular theory of the pathophysiology of migraine suggests that the migraine aura is associated with vasoconstriction and the subsequent headache is associated with vasodilation (11). The PHSVs of these patients provide evidences that SWI can reveal the region of hypoperfusion. Ischemic penumbra is the reversible area of locally decreased blood flow and oxygen transport to the brain parenchyma, which shows DWI-PWI mismatch on MRI. The PHSVs on SWI can reflect the region of hypoperfusion (10, 11) similar to the mismatch area seen on DWI-PWI. Therefore, the presence of PHSVs can also be a marker of ischemic penumbra in patients with acute ischemic stroke.
In our study, all of the patients with significant peripheral PHSV showed an increase in the extent of infarction, whereas eight patients without significant peripheral PHSV with or without core PHSV showed the same extent of infarction on follow-up images. Because the core of the infarct consists of tissue that has undergone irreversible injury, the core PHSV only cases may not be associated with an increase in the infarction area in follow-up imaging. From our results, we can hypothesize that significant peripheral PHSV represents the penumbra in acute cerebral infarction, and there is no relevant penumbra when the initial SWI shows only core PHSV or no significant peripheral PHSV.
In the assessment of acute stroke, in addition to demonstrating the reversible penumbra region, SWI can provide useful information for predicting the probability of potential hemorrhagic transformation (HT) before thrombolysis by counting the number of microbleeds (3, 12). HT is the most serious and feared sequelae of cerebral infarction. Multiple factors such as cardioembolism, a large extent of infarction and absent or poor collateral flow have been suggested to be predictors of HT so far (13, 14, 15, 16). Several investigators have recently shown that disruption of the blood-brain barrier is associated with a high risk of HT (17, 18), and permeability MR imaging can be useful in predicting HT in patients who have received thrombolysis. However, because the number of patients in this study was too small, further investigations including larger numbers of patients are needed to obtain more concrete results for relation between HT and PHSV.
Deoxygenated hemoglobin is a paramagnetic substance and oxygenated hemoglobin is a diamagnetic substance (19, 20), so changes in the ratio of oxygenated hemoglobin to deoxygenated hemoglobin in the vessels can affect the local magnetic susceptibility. Phase shift of the proton occurs in response to this change of local susceptibility (4). Utilizing deoxygenated hemoglobin as an intrinsic contrast material, this phase value on SWI can be used for the estimation of oxygen saturation theoretically. On this account, several studies were done to quantify changes in cerebral oxygen saturation and blood flow by using SWI under various experimental conditions (4, 5, 6) and demonstrated the usefulness of SWI in calculating changes of oxygen saturation, blood flow and OEF in cerebrovascular models. The OEF provides information about relative deficiencies in the blood supply compared with the tissue demand for oxygen (21, 22, 23). Some group uses T2* or T2' relaxation of the brain tissue to measure tissue OEF directly (24, 25), while other uses the phase difference between the venous blood and surrounding tissue to calculate venous oxygen saturation (4, 5, 6, 26) using special or new software program. However, without these additional software program or special tools, measuring of phase value on routine MR imaging is not easy, so tissue OEF cannot be readily obtained daily practice yet. Instead, we simply measured the signal intensity of vessels on SWI which reflects phase value.
In this study, by using SWI, we measured the signal intensity difference ratio of PHSVs to contralateral normal appearing cortical veins quantitatively. In the progression group, signal intensity difference of peripheral PHSVs was 2.4 times higher than contralateral cerebral hemisphere on average, while 0.86 times higher than in the group with little change. These results suggest that the more increase of signal intensity difference ratio in the infarction-progression group was due to increase of deoxyhemoglobin in the draining veins, probably reflecting more hypoxic condition of the brain parenchyma. Simply calculating and comparing the signal intensity difference in both cerebral hemispheres in acute cerebral infarction patients, it can be helpful in predicting prognosis of acute cerebral infarction.
This study has several limitations. First, we choose cerebral veins visually enough prominent or dilated to draw ROI, and manually draw ROI to single venous vessel on both sides of cerebral hemispheres. This made the measurements time-consuming so it is hard to done in larger population or larger areas. And the possibility of measuring error such as partial volume effect can make the measurements inaccurate. Second, the vessels used in comparison of the signal intensity difference on SWI in both cerebral hemispheres were not identical veins. Although the vessels used in calculation of this parameter were selected segmental traversing veins on same axial plane in order to minimize the angle difference to main magnetic field, these veins in contralateral hemisphere did not have same vessel course in reality. Subtle angle difference can affect in phase value difference. Third, MR sequences reflecting cerebral blood flow such as PWI or arterial spin labeling (ASL) are not routine MR protocol in our institution. We could not get hemodynamic information in initial brain MRI. The changes in oxygen saturation can be related to changes in cerebral blood flow (4). Difference of local or global cerebral blood flow can be resulted from lobar infarction or internal carotid artery stenosis and so on. We did not take into account the cerebral blood flow difference in comparison of signal intensity difference on SWI on and opposite side of cerebral infarction. Forth, clinical risk factors of cerebral infarction are not considered in assessment of the disease prognosis. Fifth, the number of patients involved in this study is too small. Further study is needed to verify this result in larger population.
In conclusion, noninvasive and quantitative measurement of hypoxic condition of acute cerebral infarction is possible using SWI, reflecting deoxyhemoglobin level in the draining veins. By evaluating PHSVs within areas of impaired perfusion, this can be a prognostic indicator of acute cerebral infarction and important for planning therapeutic strategies.
 XML Download