

 PDF
PDF ePub
ePub Citation
 Print
Print


INTRODUCTION
Patients with rectal cancer in the lower third of the rectum have three main options for surgical treatment including transanal resection, abdominoperineal resection (APR), total mesorectal excision (TME) and preoperative concurrent chemoradiotherapy (CCRT) with surgical management. However, APR can lead to a decreased quality of life, viewed in colostomy and compared to other surgical treatments. To achieve an acceptable quality of life, sphincter-saving procedures have become increasingly popular (1, 2). In recent years, high-resolution pelvic magnetic resonance imaging (MRI) has achieved an essential role in the determination of circumferential resection margin (CRM) and the evaluation of sphincter invasion. The prediction of sphincter involvement and measurement of the distance from the anal verge are important for treatment planning in patients with lower rectal cancer (2, 3).
Several studies have reported that pelvic MRI with rectal contrast filling including diluted barium suspensions, methylcellulose, superparamagnetic iron oxide solutions and water improve tumor depiction and estimation of tumor extension in the rectum (4, 5, 6, 7, 8). The MRI jelly method, in which ultrasonographic transmission gel is injected into the vagina and rectum, has been widely used for detection of deep pelvic endometriosis for many years (9, 10). Recently, Kim, et al. (11) reported that ultrasonographic transmission gel is an effective and safe contrast material for use in the rectum on pelvic MRI. And also ultrasonographic transmission gel improves the tumor depiction and estimation of tumor extension in the rectum, it may be helpful for planning of endoscopic mucosa resection or dissection at T1 cancer, but the influence of gel insertion in the rectum is not disclosed for tumor staging, CRM involvement prediction and sphincter involvement prediction at lower rectal cancer. Our study was aimed to assess the usefulness of pelvic MR with and without gel filling in patients with lower rectal cancer with regard to tumor depiction, sphincter involvement, CRM involvement, T staging, N staging and tumor distance measurement (from the anal verge).
MATERIALS AND METHODS
Patient populations
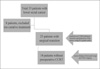
This retrospective study was designed from October 2008 to February 2009 after approval by the institutional review board. During this period, thirty-three patients with histologically proven lower rectal cancer (lower rectal cancer was defined as, clinically < 8 cm from the anal verge to the distal tumor margin, as determined with sigmoiodoscpy or rectal exam) were enrolled. These patients underwent 1.5 T or 3 T high resolution pelvic MRI, before and after rectal distention, for treatment planning. Among the 33 patients, eight patients were excluded because they did not receive any curative treatment. Our study required pathologic or surgical results for analysis but surgical management was not performed in these cases. Twenty-five patients (mean age - 58.8 years, age range - 40-80 years; M:F - 16:9) underwent curative resection (ultra-lower anterior resection and lower anterior resection), and 11 of them had a preoperative CCRT due to sphincter invasion and/or CRM involvement (Fig. 1). Fourteen patients without CCRT underwent radical surgery within one month, after MR exam. Eleven patients with CCRT underwent radical surgery within two months, after CCRT (Fig. 1).
MRI Technique
MRIs were performed with a 1.5T scanner (MagneAvanto; Siemens Medical Systems, Erlangen, Germany) and a 3T scanner (Achieva; Philips, Eindhoven, Netherlands). The patients did not undergo bowel preparation; however, before the exam, if not contraindicated, 20 mg of intravenous scopolamine butyl bromide (Buscopan, Boehringer Ingelheim) was administered to minimize peristalsis and prevent rectal spasm and all patients in this study were administered only one time before the examination. The following imaging sequences were performed before and after rectal distension on a 1.5 T scanner: T1-weighted turbo spin-echo MRI (TR/TE 530/10 ms, matrix size 448×358, 3-mm slice thickness, 0.3-mm intersection gap, and 20 cm × 20 cm field of view) in the axial plane and T2-weighted turbo spin-echo MRI (TR/TE 3400/100 ms, matrix size 512×180, 3-mm slice thickness, 0.3-mm intersection gap, and 20 cm × 20 cm field of view) in the axial, oblique coronal, and sagittal planes. Also the following imaging sequences were performed before and after rectal distension on a 3T scanner: T1-weighted turbo spin-echo MRI (TR/TE 550/10 ms, matrix size 500×500, 3-mm slice thickness, 0.3-mm intersection gap, and 25 cm × 25 cm field of view) in the axial plane and T2-weighted turbo spin-echo MRI (TR/TE 3500/90 ms, matrix size 500×500, 3-mm slice thickness, 0.3-mm intersection gap, and 25 cm × 25 cm field of view) in the axial, oblique coronal, and sagittal planes. In tumor level, all axial images were obtained at angled to the axis of the rectal tumor.
Approximately 50 ml to 100 ml of warm ultrasonographic transmission gel was injected using a balloontipped rectal tube. If patients were uncomfortable, the injection was stopped. The rectal tube was carefully removed after administration of the gel. During MR examination, all patients with rectal gel filling showed good tolerance. The MR procedure time, including the time for rectal gel administration, consumed approximately fifty to sixty minutes in this study.
Image Analysis
Two radiologists with five years and more than ten years of experience in pelvic MRI interpretation, respectively, independently and separately analyzed each set of axial, oblique coronal and sagittal T2-weighted images from 25 patients (MR exams before and after gel filling) using five-grade scales [1-5] without clinical information. Five grade scales were used to determine sphincter involvement (we defined that tumor infiltration/invasion is seen at the external anal sphincter and/or levator ani muscle; 1, definitely absent; 2, probably absent; 3, possibly present; 4, probably present; and 5, definitely present), CRM involvement (we defined that tumor is abutting to or out of mesorectal fascia; 1, definitely absent; 2, probably absent; 3, possibly present; 4, probably present; and 5, definitely present) and depiction of the tumor (1, could not indentify tumor ; 2, partially indentified tumor; 3, indentified tumor but could not demarcate margins; 4, presence of tumor and partially demarcated margin; and 5, well configured tumor and well demarcated tumor margin; with a focus on the intraluminal part of the tumor).
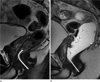
The same two radiologists reviewed with consensus each set of MR images (before and after gel filling) of 14 patients who underwent surgery without preoperative CCRT to determine the tumor distance from the anal verge, tumor staging (T) and nodal staging (N, Rather than using size, we used the criteria for lymph node metastasis as a node of any size with an indistinct border, irregular margin, or mixed signal intensity) (3). We excluded preoperative CCRT cases, because pathological results and tumor distances after CCRT were changed compared to those of preoperative MRI. The tumor distance was measured from the anal verge to the distal tumor margin on sagittal T2-weighted images (Figs. 1, 2). All images were reviewed using a full picture archiving and communication system workstation (General Electric Medical system).
Data Analysis
The scores for sphincter involvement, CRM involvement and tumor depiction, as rated by two radiologists, were compared using Wilcoxon's signed rank test to differentiate the methods. The weighted kappa test was applied for interobserver variability, in which a kappa value less than 0.20 indicated poor agreement; 0.21-0.40 was considered fair agreement; 0.41-0.60 represented moderate agreement; 0.61-0.80 indicated substantial agreement; and 0.81 or greater implied excellent agreement.
Measurement of tumor distance using rigid endoscopy during surgery was the defined reference method. A paired t-test was used to analyze differences in tumor distance between each MRI set and rigid endoscopy during surgery. Pathological T&N staging was defined as the gold standard, and a paired t-test was used to analyze differences in T&N staging between predictions of each MRI set and pathological results. We also calculated the accuracy of each MRI Tstaging and N-staging, based on the pathological results.
Analyses were performed using SPSS version 15.0 (SPSS, Chicago, Ill). In all statistical analyses, differences were considered significant when the P value was less than 0.05.
RESULTS
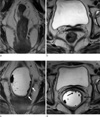
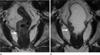
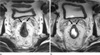
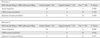
Tumor depiction scores from MRI with gel filling were significantly higher than those in MRI without gel filling (p<0.001). Compared to MRI without gel filling, MRI with gel filling revealed no significant difference in CRM or sphincter involvement (p>0.05) (Table 1, Figs. 3, 4, 5). Interobserver agreement (kappa=0.60) was moderate.
Distance from the anal verge was significantly different between MRI with gel filling and rigid endoscopy (p=0.001, rigid sigmoidoscopy vs. MR with gel filling: 5.8 ± 1.6 cm vs. 6.8 ± 1.6 cm) (Fig. 2), The distance from the anal verge was not significantly different between MRI without gel filling and rigid endoscopy (p=0.786, rigid sigmoidoscopy vs. MR without gel filling: 5.8 ± 1.6 cm vs. 5.6 ± 1.4 cm).
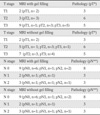
There were no statistical differences between pathological staging and MRI staging with and without gel filling (P>0.05) - accuracies of T staging of MRI with gel filling vs. MRI without gel filling: 71% vs. 64%; accuracies of N staging of MRI with gel filling vs. MRI without gel filling: 57% vs. 57% (Table 2).
DISCUSSION
In patient with rectal cancer within the lower third of the rectum, surgeons struggle to balance the risk of loco-regional recurrence and the patient's quality of life. Recently, high-resolution pelvic MRI provides useful information for the determination of sphincter-preserving surgery. And pre-operative CCRT diminishes the rate of local recurrence and enables to sphincter-preserving surgery in lower rectal cancer (1, 2, 3, 12). So preoperative staging of rectal cancer in the lower third of the rectum is important for therapeutic planning, and MRI has a more important role. However, the accuracy of CRM involvement prediction has been shown to be lower for lower rectal cancer compared to those of upper and mid rectal cancers (13). And surrounding anatomic structures in lower rectum are complicated and have a narrow interval.
To improve the diagnostic accuracy of MRI in patients with rectal cancer, many materials including diluted barium suspensions, methylcellulose, superparamagnetic iron oxide solutions and water have been used for rectal distention. The rationale for rectal distention is to improve distinction between the lumen and the inner wall of the rectum, distinguishing the tumor from fecal material or edematous normal bowel wall and demarcating tumor from perirectal fat.
Compared to prior studies, our study revealed similarly improved tumor depiction (4, 5, 6, 7, 8). MRI with gel filling was significantly superior to MRI without gel filling for tumor depiction. This improvement may help in the planning of endoscopic mucosal resection or submucosal dissection in cases of T1 rectal cancer. We believe that MR with gel filling will influence the prediction of CRM/sphincter invasion because Slater A et al (14) reported that rectal distension by air significantly reduces the distance between the rectal wall and mesorectal fascia and possibly affects the accuracy of CRM determination. In particular, we thought that CRM invasion prediction would be overestimated at the anterior wall of the lower rectum by luminal distention. However, this procedure did not significantly improve or hinder CRM/sphincter invasion prediction (Table 1).
Ultrasonographic transmission gel is a non-magnetic semisolid material to characterize high signal intensity on T2 weighted images; therefore, tumor depiction is clearly improved by high contrast on T2 weighted imaging. This gel is also inexpensive and easy to insert using small volume. Compared with a prior water distention study (5), the volume of ultrasonographic transmission gel necessary for adequate distention of the rectum was smaller, 50-100 mL compared to the 200-500 mL of water required. In this study, all patients with rectal gel filling showed good tolerance during MR examination, as the contrast is a semisolid and is present in only a small volume. The water filling method has a drawback to create an uncontrolled air fluid level and it caused of artifact to limitation of assessment at the anterior wall of rectum (5, 11). In our study, small air bubbles were located at the gel interspace or boundary of the gel but did not cause artifacts that hindered interpretation. Moreover, all patients were administered 20 mg of intravenous scopolamine butyl bromide before the examination to minimize peristalsis and prevent rectal spasm. Artifacts related to bowel peristalsis did not exist nor hindered our interpretation.
In this study, there were no statistical differences between pathological staging and MRI staging with and without gel filling. However, calculation of accuracy in each MR set, based on pathologic result, MRI with gel filling demonstrated slight improvement in T staging (MRI with gel filling vs. MRI without gel filling: 71% vs. 64%). The accuracies of N staging for the MRI sets were equal (57%) (Table 2). The overall accuracy of MR imaging in predicting T staging has been reported from 71%-91% (mean, 85%), and the range of overall accuracy of MR imaging in predicting N staging was 43%-85% (mean, 75%) (15, 16, 17, 18, 19, 20, 21, 22, 23, 24).
Flexible sigmoidoscopy is the reference tool for diagnosis of rectal cancer, but its ability to location of tumor has been questionable. The tumor location and distance were very important for surgical planning and recently rigid sigmoidoscopy allows more accurate measurements (25). Baaturp et al. (26) reported that MRI and rigid sigmoidscopy are not interchangeable in determining the distance from anus to tumor. They performed MRI with gel filling (100-150 ml) and measured the distance from the puborectal muscle to the tumor. There was a discrepancy of average tumor distance between MRI and rigid sigmoidoscopy at the rectum (MRI vs. rigid sigmoidoscopy: 61 mm vs. 82 mm in rectum). In our study, there was also discrepancy between rigid sigmoidocopy and MRI with gel filling at the lower rectum (p=0.001, rigid sigmoidoscopy vs. MR with gel filling: 5.8 ± 1.6 cm vs. 6.8 ± 1.6 cm in lower rectum). We suggested that this difference is because rigid sigmoidoscopy draws a straight measurement line while MRI uses a curved measurement line. Measurement of tumor distance using rigid sigmoidoscopy might lead to underestimation, as the curve of the rectum is straightened during this procedure. On the other hand, the rectum was more stretched after rectal gel filling, than under sigmoidoscopy, therefore the tumor distance with gel filling might be exaggerated. This mild exaggeration of tumor distance was within an acceptable range and was helpful in treatment planning. During the surgical procedure, remaining proximal and distal bowel loops were dragged in maximum for anastomosis after tumor resection; therefore, measurement of the distended bowel loop is helpful for surgical planning.
The main limitation of our study was the small number of patients. Data collection period was only 5 months, because twice MR exams in each patient were performed during this period (because of restraint of scan time and patient's inconvenience). Now all MR exams for rectal cancer evaluation are performed with only gel filling. In addition, we limited the enrollment of patients to only rectal cancer patients with cancer in the lower rectum. In particular, the number of patients for the prediction of T and N staging and prediction of sphincter involvement was small. Patients who did not receive preoperative CCRT demonstrated lower tumor staging compared with that of patients who did undergo preoperative CCRT. This selection bias may affect the results of accuracy of T&N staging in each MRI set. Though this study was small number patients, our study had a unique merit, in which twice MR exams was performed from the same patient. Secondary, the use of different MRI machines may have also influenced our results but we didn't differ 1.5 T and 3 T MRI during imaging analysis, because we obtained T2 weighed images by turbo spin-echo sequence on 1.5 T and 3T MR machines. Because the clinical information obtained from 3 T and 1.5 T MRI with turbo spin-echo was not much different. Turbo spin-echo sequence of 3T provided a much higher matrix size than that of 1.5T and it provided a much greater resolution of certain anatomic structures but it produced noisier images by peristaltic artifacts (27). Thirdly, during analysis of MR exam sets, tumor location - such as anterior wall, posterior wall, lateral spread, etc - was not considered. Tumor location possibly affected the analysis of CRM involvement and sphincter involvement. In addition, the pathological type was not considered in this study. Also radiologists, who analyzed images, had known information of rectal cancer and this information had affected this study by bias.
In conclusion, MR with gel filling improved tumor depiction. And also MR with gel filling revealed same ability for the predictions of CRM or sphincter invasion in patients with lower rectal cancer, comparing with MR without gel filling.
 XML Download