

 PDF
PDF ePub
ePub Citation
 Print
Print


INTRODUCTION
In patients with hypertrophic cardiomyopathy (HCM), diastolic dysfunction is common and most frequently assessed by the transmitral flow velocity pattern with the use of the pulsed Doppler technique (1, 2, 3, 4). Transmitral inflow velocity pattern is determined by transmitral pressure gradient reflecting the status of myocardial relaxation and left atrial (LA) pressure. As diastolic function worsens and/or LA pressure increases, mitral flow velocity patterns change predictably. One limitation of mitral inflow velocity pattern for the evaluation of diastolic function is a "pseudo-normalized" pattern when LA pressure is moderately elevated in the setting of delayed myocardial relaxation which is often difficult to be distinguished from true normal filling pattern. In that situation, pulmonary vein Doppler velocity recording is helpful to assess diastolic function and filling pressure (5, 6, 7).
Cardiac magnetic resonance imaging (MRI) is becoming an attractive alternative technique to assess HCM with clear delineation of cardiac structures and detection of myocardial fibrosis using delayed enhancement (8). Moreover, since phase-contrast MR imaging allows quantitative assessment of transvalvular blood velocity, with the advantage of the topographic plane of interest being positioned optimally, it would be helpful if diastolic function could be assessed by cardiac MRI in patients with HCM. Up to now, a few studies demonstrated the usefulness of diastolic function analysis using cardiac MRI (9, 10, 11); however, none of these previous studies focused specifically on phase-contrast MRI through the mitral valve and pulmonary vein in patients with HCM. The purpose of this study was to assess the role of cardiac MRI in the assessment of diastolic function using quantification of flow across the mitral valve and pulmonary vein in patients with HCM.
MATERIALS AND METHODS
Patients
From March 2008 to November of 2009, cardiac MRIs for 59 patients (44 men and 15 women, mean age; 51 years, age range; 21-73 years) with HCM were performed. Of the 59 patients, 50 underwent cardiac MRI and echocardiography on the same day, and 9 underwent cardiac MRI within one week from the time of the echocardiography examination. The diagnosis of HCM was based on the echocardiographic demonstration of a non-dilated and hypertrophied left ventricle in the absence of other cardiac or systemic diseases that could produce left ventricular hypertrophy (12). A non-dilated left ventricle was defined as a left ventricular end-diastolic dimension of less than 52 mm (13). Our institutional review board approved this study, and we got informed consent from all patients.
Magnetic Resonance Imaging
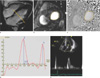
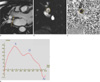
All MR studies were performed using a 1.5-T scanner (Magnetom Avanto, Siemens AG Medical Solutions; Erlangen, Germany) using a 32-channel, phased-array, dedicated cardiac coil in the supine position. With scout images to identify the left ventricle in the horizontal long axis view, cine images were acquired using a balanced steady-state free precession (bSSFP) technique to permit the visualization of the tips of the mitral valve leaflets. To get the crosssectional flow information, an imaging plane was planned parallel to the mitral annulus at the level of the mitral leaflet tips using a 4-chamber image (Fig. 1). After identification of the right superior pulmonary vein, phase-contrast MRI was also performed perpendicular to that proximal at the junction of the right superior pulmonary vein with the left atrium (Fig. 2). Phase-contrast MR were obtained with the following parameters: slice thickness 6 mm, matrix 192 × 132, repetition time 5.0 ms, echo time 2.5 ms, field of view 32 to 34 cm, flip angle 30°, 30 reconstructed cardiac phases with retrospective cardiac gating. The temporal resolution of the flow graph was defined by the heart beat interval and the number of reconstructed phases: for a heartbeat of 60 beats/min, 33 ms. The temporal resolution was defined by the repetition time (10) and the number of velocity encoding acquisition plus one velocity compensated acquisition: 50 ms (2 × TR × number of segments). The velocity-encoding gradient values were 200 cm/s for mitral valves and 100 cm/s for pulmonary veins. Acquisitions were acquired during suspended inspiration. Inflow patterns through the mitral valve and pulmonary vein were analyzed on a Siemens MR workstation (Syngo Argus Flow Analysis; Siemens Medical Solutions; Erlangen, Germany). An experienced radiologist who had three years of experience with cardiac MRI put a region of interest (ROI) within the mitral valve and pulmonary vein and traced the lumen using semi-automated edgedetection algorithm on all phases with additional manual adjustment of any inaccurate traces. The calculated inflow parameters of the mitral valve included early (E) and late peak (A) velocities (cm/s), E/A ratio, and deceleration time (ms). The inflow parameters of the pulmonary vein were systolic (S), diastolic (D), and late arterial systolic filling (Ar) wave velocities. Diastolic function was graded following the classification based on Doppler echocardiography using the transmitral flow parameters (11): normal and pseudo-normal (grade 2) (0.75 < E/A ≤ 1.5, deceleration time > 140 ms); grade 1 (impaired relaxation: E/A ratio ≤ 0.75); and grade 3 (restrictive filling: E/A >1.5 and deceleration time < 140 ms) by the consensus of two radiologists each with 20 years and three years of experience with cardiac MRI, respectively without the knowledge of echocardiographic findings. Pulmonary vein flow parameters were used for differentiating pseudo-normal from normal diastolic function; when S < D or duration of Ar duration was longer than A duration (late peak velocities measured on mitral valve) + 30 ms (14, 15). Disagreement between the two radiologists was resolved in conference with a third observer who had 10 years of experience in echocardiography and two years of experience in cardiac MRI.
Transthoracic echocardiography
Echocardiographic images were reviewed independently without knowledge of the cardiac MR findings by consensus of two experienced cardiologists with 10 and 25 years experiences in echocardiography. The patients' diastolic function was classified as normal (grade 0), impaired relaxation (grade 1), pseudonormal (grade 2), and restrictive (grade 3) according to the current guidelines using echocardiographic diastolic parameters as follows; isovolumic relaxation time (IVRT), transmitral inflow parameters (E and A velocities, E/A ratio, deceleration time), mitral tissue Doppler velocity (early [e'] and late [a'] peak diastolic velocity), and pulmonary venous inflow pattern (7, 16, 17). Grades 1 to 3 were considered as "positive" for diastolic dysfunction (7, 16, 17).
Statistical Analysis
Data collection and analysis were performed using previously reported methodology (10, 11) with some modifications. Transmitral inflow parameters using MRI and echocardiography were compared by linear regression and Pearson's correlation method. Comparison between E/A ratios in both modalities was further performed using a Bland-Altman analysis. Diastolic function grades of cardiac MRI using flow information through the mitral valve and pulmonary vein were compared with those of echocardiography using Cohen's kappa statistics (18). A value of 1 indicates perfect agreement, and a value of 0 indicates no agreement. In general, values less than 0.40 indicate poor agreement, values between 0.41 and 0.60 indicate moderate agreement, values between 0.61 and 0.80 indicate good agreement, and values above 0.81 indicate very good agreement. Statistical significance was calculated at a 95% confidence interval (P < 0.05). Data processing and analysis were performed with a commercially available software program (SPSS, version 10.0; Chicago, IL., USA).
RESULTS
Patients' demographic and echocardiographic characteristics
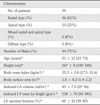
The demographic and echocardiographic characteristics of the 59 patients have been summarized in Table 1. Of 59 patients, the most common type of HCM was asymmetric septal type in 36 patients, followed by apical type (n = 13), mixed septal and apical type (n = 5), and symmetric diffuse HCM (n = 5). Forty-nine patients had a diastolic dysfunction; grade 1 (n = 20), grade 2 (n = 27), and grade 3 (n = 2) using echocardiography, and ten patients had normal diastolic function.
Comparison of diastolic parameters between MRI and echocardiography
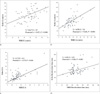
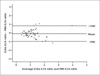
MRI successfully obtained all diastolic parameters (E velocity, A velocity, deceleration time, and S, D, and Ar) in all patients. For the 59 patients, E velocity was 38 ± 12 cm/s using MRI versus 63 ± 18 cm/s using echocardiography (echocardiography E velocity = 0.67 × MRI E velocity + 37, Pearson's r value = 0.47, P < 0.001), and A velocity was 36 ± 14 cm/s using MRI versus 63 ± 21 cm/s using echocardiography (echocardiography A velocity = 0.90 × MRI A velocity + 31, Pearson's r value = 0.60, P < 0.001). Despite the positive correlation between the two modalities, the overall E and A velocities using MRI were lower than with those of echocardiography. The E/A ratio was 1.22 ± 0.64 using MRI and 1.13 ± 0.62 using echocardiography (echocardiography E/A = 0.73 × MRI E/A + 0.2, Pearson's r value = 0.75, P < 0.001) (Table 2) (Fig. 3). Further, the Bland-Altman analysis showed a mean difference between echocardiographic E/A ratio and MRI E/A ratio of -0.085 ± 0.45 (SD) (Fig. 4). Deceleration time between the two examinations (190 ± 56 ms using MRI and 237 ± 78 ms using echocardiography) showed a poor correlation (echocardiography deceleration time = 0.56 × MRI deceleration time + 132 ms, Pearson's r value = 0.40, P = 0.02) (Table 2) (Fig. 3).
Comparison of diastolic dysfunction grades categorized by MRI and echocardiography
When diastolic function was categorized with only transmitral inflow information (E, A, E/A, deceleration time), 19 patients (32%) had same diastolic dysfunction grades with that of echocardiography (17 of grade 1 and two of grade 3). However, 25 patients (42%) could not be determined between normal and pseudonormal filling. Judging from the flow information of the pulmonary vein (the ratio of S and D, and Ar) from cardiac MRI, the 25 patients could be subsequently categorized into normal (n = 17) and pseudo-normal (n = 8) groups, and 59% (35/59) of patients had the same grades with those of echocardiography, which was significant higher than when they were graded without the information of pulmonary vein velocities (32%, 19/59; P < 0.001). The assessment of diastolic function grade of phase-contrast MRI showed moderate agreement (kappa valve = 0.45, P < 0.001) with that of echocardiography. Moreover, with the information for transmitral inflow and pulmonary vein velocities, the accuracy of phase-contrast MRI for the diagnosis of diastolic dysfunction was 81.4%.
DISCUSSION
A comprehensive evaluation of ventricular function comprises the assessment of both left ventricular systolic and diastolic function. Cardiac MRI has been considered as a gold-standard for the evaluation of systolic function because of the high reproducibility of the results (19). For the assessment of diastolic function, Doppler echocardiography has been commonly used due to its relative low cost and easily accessible characteristics; however, limited acoustic windows and the operator-dependent characteristics have been the main problems related to this type of examination. Phasecontrast MRI is a reliable modality for quantifying blood flow and several previous studies described the use of phase-contrast MRI for the evaluation of diastolic function (9, 10, 11, 15, 20, 21). MRI is advantageous in providing information on myocardial tissue characterization with late gadolinium enhancement (8, 22, 23, 24), while information on diastolic function with phase-contrast MRI would be an incremental value for HCM patients.
In this study, we revealed positive correlation between echocardiography and MRI in estimating transmitral inflow parameters (E velocity, A velocity, and E/A ratio) for HCM patients. We also assessed the feasibility and usefulness of pulmonary vein velocities on MRI, which is considered as other incrementally useful diastolic function parameters. Results indicated that MRI successfully obtained all trans-pulmonary vein flow parameters (S, D, and Ar) for all patients. All patients were successfully categorized into diastolic function grades based on information of pulmonary vein velocities, and 59% patients were concordant with the grades from echocardiography, which were significant higher than those graded without information about pulmonary vein velocities. Despite the similar pattern, the overall E and A velocities using MRI was lower than that with echocardiography, which was in agreement with previous studies (9, 10, 11). The relatively lower temporal resolution of the breath-hold phase-contrast MRI technique might help explain the lower peak velocities measured using MRI compared with echocardiography. Recently, powerful gradients and faster computing power have led to shorter echo time and repetition time with better results than previous studies (10). These technical improvements could have also led to real-time MRI applications. And Application of three- or four-dimensional and freebreathing techniques of phase-contrast MRI may even further improve the accuracy of diastolic function analysis in these patients and overcome difficulties related to the motion of the mitral valve plane during the cardiac cycle (11, 25, 26).
There were several limitations to the present study. First, the number of patients was small because this study was performed at a single institution. Second, the patients did not undergo left ventricular catheterization which has been regarded as the gold standard of diastolic function analysis. However, with respect to invasive characteristics, catheterization is seldom used in the clinical setting. Third, we evaluated MRI-based diastolic function grades using transmitral and pulmonary vein inflow pattern, and compared that with diastolic function grades evaluated by echocardiography using IVRT, transmitral inflow parameters, mitral tissue Doppler velocity, and pulmonary venous inflow. We think this is the main reason why the diastolic function grades are different between echocardiography and MRI, even though velocities, ratio, and DT show good correlation between two modalities. Although echocardiography is the modality of choice for assessing diastolic function, assessment of diastolic dysfunction is not that simple; to maximize the accuracy of echocardiography for diastolic dysfunction, a lot of information (IVRT, transmitral inflow parameters, mitral tissue Doppler velocity, and pulmonary venous inflow pattern) are all summed up. However, we could not examine all of the parameters with MRI, because of the scan time is limited and clinical usefulness for the parameters hasn't be confirmed with MRI. Finally, we analyzed the MR inflow information according to echocardiography criteria because there was no established criterion for grading diastolic function specifically on MRI. Further prospective study is needed regarding the guidelines for using MR in diastolic function grading. We anticipate that our results may be used as baseline data for future studies in the establishment of criteria for the grading of diastolic function analysis specifically through MRI.
In conclusions, assessment of left ventricle diastolic function is feasible using phase-contrast MRI in patients with HCM. Analysis of pulmonary vein flow velocity on MRI gives additional information on diastolic function of the left ventricle.

 XML Download