Journal List > J Korean Soc Magn Reson Med > v.18(4) > 1011933

Roh, Kang, and Kim: Clinical Applications of Neuroimaging with Susceptibility Weighted Imaging: Review Article

Abstract

Purpose

Susceptibility-weighted magnetic resonance (MR) sequence is three-dimensional (3D), spoiled gradient-echo pulse sequences that provide a high sensitivity for the detection of blood degradation products, calcifications, and iron deposits. This pictorial review is aimed at illustrating and discussing its main clinical applications.

Materials and Methods

SWI is based on high-resolution, 3D, fully velocity-compensated gradient-echo sequences using both magnitude and phase images. To enhance the visibility of the venous structures, the magnitude images are multiplied with a phase mask generated from the filtered phase data, which are displayed at best after post-processing of the 3D dataset with the minimal intensity projection algorithm. A total of 200 patients underwent MR examinations that included SWI on a 3 tesla MR imager were enrolled.

Results

SWI is very useful in detecting multiple brain disorders. Among the 200 patients, 80 showed developmental venous anomaly, 22 showed cavernous malformation, 12 showed calcifications in various conditions, 21 showed cerebrovascular accident with susceptibility vessel sign or microbleeds, 52 showed brain tumors, 2 showed diffuse axonal injury, 3 showed arteriovenous malformation, 5 showed dural arteriovenous fistula, 1 showed moyamoya disease, and 2 showed Parkinson's disease.

Conclusion

SWI is useful in detecting occult low flow vascular lesions, calcification and microbleed and characterising diverse brain disorders.

INTRODUCTION

Several important tissues have unique magnetic susceptibility differences relative to surrounding tissues. Signals from these substances will become out of phase with background tissues at sufficiently long echo times. Thus phase imaging offers a means of enhancing contrast in magnetic resonance (MR) imaging. In 1997, it was possible to remove most of the unwanted phase artifacts and keep the local phase of interest (1). Combining the phase and the magnitude information made a new susceptibility weighted magnitude image, which is called today as susceptibility-weighted imaging (SWI) (2).
SWI is based on high-resolution, 3D, fully velocity-compensated gradient-echo sequences using both magnitude and phase images. To enhance the visibility of the venous structures, the magnitude images were multiplied with a phase mask generated from the filtered phase data, which are displayed at best after post-processing of the 3D dataset with the minimal intensity projection (minIP) algorithm.
This pictorial review is aimed at illustrating and discussing its main clinical applications.

MATERIALS AND METHODS

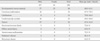
After obtaining local ethics committee approval, between March 2011 and February 2013, data in 200 consecutive patients who met the inclusion criteria for this study were retrospectively reviewed from our data base. Inclusion criteria were the following: 1) Patients underwent MR examinations that included SWI on a 3 tesla (T) MR imager, and 2) they had lesions of clinical significance and cerebrovascular pathology. Among the 200 patients, 80 showed developmental venous anomaly (DVA), 22 showed cavernous malformation, 12 showed calcifications in various conditions, 21 showed cerebrovascular accident (CVA) with susceptibility vessel sign or microbleeds, 52 showed brain tumors, 2 showed diffuse axonal injury (DAI), 3 showed arteriovenous malformation (AVM), 5 showed dural arteriovenous fistula (AVF), 1 showed moyamoya disease, and 2 showed Parkinson's disease (Table 1).
MR imaging was performed on a 3T (Siemens, Skyra, Erlangen, Germany) equipped with a 20-channel head coil. The imaging parameters for the SWI were: TR/TE = 28/20 ms, FA = 15°, BW = 120 Hz/pixel, spatial resolution = 0.3 × 0.3 × 1.2 mm3 and field-of-view = 230 mm.

RESULTS

Normal appearance of intracranial structures on SWI

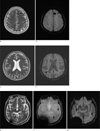
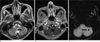
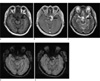
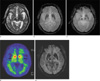
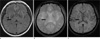
Figure 1 illustrates the normal appearance of intracranial structures on minIP SWI. The white matter slightly hyperintense to gray matter. The red nucleus, substantia nigra, lentiform nucleus and globus pallidi are low signal intensity due to iron deposition (Fig. 1). This becomes more pronounced with increasing age (Fig. 2) (3).
The small cortical veins are seen as linear low signal intensities due to signal loss from deoxyhemoglobin in venous blood. But, the major venous sinuses are of larger caliber with faster venous flow, and because they entirely occupy several voxels, there is no signal loss as with small subvoxel veins (4).

Developmental venous anomaly

DVA is considered to be incidental malformations of venous drainage patterns. There is no arterial component in this entity. Normal brain tissue is present between the veins comprising the lesion. DVA may represent the most common cerebrovascular malformation, accounting for 63% of vascular malformations in one large study, with an overall incidence of 2% (5). SWI can readily demonstrate the slow venous flow in these lesions and their characteristic curvilinear vascular channels receiving drainage from a spoke wheel-appearing collection of small, tapering veins arranged in a radial pattern (Fig. 3).

Cavernous malformation

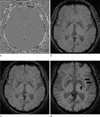
Cavernous malformation represents a pathologic subtype of vascular malformation, appearing as discrete, compact, honeycomb like masses of endothelial-lined sinusoidal vascular spaces that contain essentially thrombosed blood. This lesions is congenital. The key features of T2-weighted image are focal central heterogeneity containing areas corresponding to subacute-chronic hemorrhage, circumferential complete rings of markedly hypointense iron-storage forms around these high-intensity central areas, no mass effect or edema (Fig. 4a, c). SWI has exquisite sensitivity for hemosiderin and calcification in theses lesions (Fig. 4b, d). Without SWI, small vascular malformations could be missed by conventional imaging techniques such as T2-weighted image, gradient recalled echo (GRE) (Fig. 4e, f, g).

Arteriovenous malformation

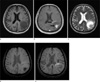
The most common clinically symptomatic cerebrovascular malformation is the AVM. AVM represents congenital anomaly of blood vessel development and result from preservation of direct communication between arterial and venous channels without an intervening capillary network (6). The nidus, that is the site of primitive communication which replaces the normal arterioles and capillaries, permits increased flow through the arterial feeding vessels to the AVM and delivers increased blood volume under relatively high pressure into the cerebral venous system. T2-weighted image demonstrates marked hypointensity along the surface of the brain parenchyma or along the ependymal surface of the ventricle in this entity (Fig. 5a). SWI can demonstrate the tangle of arterial feeding vessels and the enlarged draining veins as well as hemorrhage (Fig. 5b).

Calcification

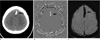
Computed tomography (CT) has long been considered the gold standard in detecting calcification. In conventional MRI such as spin echo T1- or T2-weighted images and GRE, calcifications usually appear as hypointense and cannot be differentiated from hemorrhage. MRI has been thought to be the best imaging modality in the central nervous system, but there are occasions when a CT scan needs to be obtained to confirm the presence of calcification suspected on MRI when it becomes a critical sign in diagnosis. It has been recognized that using phase helps to discriminate between calcium and iron because calcifications tend to be diamagnetic and iron paramagnetic, thus they appear with the opposite signal intensity in filtered phase images (Fig. 6) (7).

Cerebrovascular accident

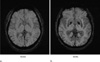
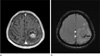
In case of acute ischemic stroke, the presence of prominent veins, microbleeds and the "susceptibility vessel sign" in SWI has been considered to be useful in evaluating stroke severity, treatment and prognosis (8). In acute stroke, presence of unpaired electrons in deoxyhemoglobin, methemoglobin within the occluded vessel gives them paramagnetic properties, which causes signal loss on MRI, which is best detected using T2*-weighted sequences - the so called "susceptibility vessel sign". The presence of prominent veins was hypothesized to be caused by the increased oxygen extraction fraction (OEF), which reflects the ratio of deoxyhemoglobin to oxyhemoglobin in the capillaries and veins. Since the OEF is increased in the penumbra following acute ischemic stroke, these hypointense signals shown by SWI could possibly represent the penumbra (Fig. 7). Acute infarction with subsequent tissue breakdown and reperfusion phenomenon can lead to secondary petechial hemorrhage. Demonstration of hemorrhage can alter clinical management. SWI has exquisite sensitivity for small foci of hemorrhagic transformation and microbleeds within the infarct.

Brain tumors

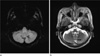
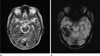
The development of SWI allows improved contrast and detection of both the venous vasulature and hemorrhage within tumors which cannot be seen with conventional imaging methods (Fig. 8) (4) and tiny hemorrhagic metastasis (Fig. 9).
The internal architecture of tumors varies significantly between SWI and contrast-enhanced T1-weighted image. Figure 10 shows an example of the internal vascular structure of a lesion that is not visible even with the use of a contrast agent on conventional MRI (Fig. 10). Internal architecture on contrast enhanced T1-weighted image is determined by the presence of necrosis, cysts, and tumor boundaries, whereas the internal architecture on SWI is determined mostly by blood products, either from spontaneous bleeding or from surgical trauma. This difference in image appearance can allow recurrent tumor to be distinguished from postsurgical changes (9).
In one study (10), SWI is much more sensitive than any other tested sequence for detecting blood products and venous vasculature. SWI postcontrast is also somewhat better than noncontrast SWI for the visualizing tumor margin (Fig. 11).

Moyamoya disease

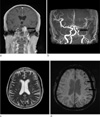
Moyamoya disease is an uncommon cerebrovascular disease characterized by progressive stenosis of the terminal portion of the bilateral internal carotid arteries and circle of Willis with bilateral involvement of the anterior cerebral arteries, MCAs and the posterior cerebral arteries that leads to the compensatory formation of an abnormal network of perforating blood vessels, named Moyamoya vessels, that provide collateral circulation. The clinical presentations are intracranial bleeding, transient ischemic attack or cerebral infarction.
Variable perfusion scan modalities such as single-photon emission computed tomography (SPECT), positron emission tomography (PET), Xenon-CT, and dynamic perfusion CT have been applied to predict the patients with severe hemodynamic impairments. Dynamic susceptibility contrast (DSC) MR perfusion imaging and ASL are available for quantitative hemodynamic analysis.
SWI can be used to evaluate deep venous flow in acute or chronic ischemia and to demonstrate increased oxygen extraction in focal cerebral ischemia (11, 12). In this report, we describe characteristics of the signal intensity of deep medullary vessels of Moyamoya disease by using SWI (Fig. 12).

Neurodegenerative disease

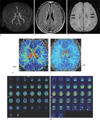
Abnormal iron accumulation occurs in the brains of patients with various neurodegenerative diseases such as Parkinson's disease, multiple system atrophy, Alzheimer disease, and multiple sclerosis. MR imaging such as T2*-weighted image, GRE has been demonstrated to be an important tool to quantify iron content in vivo (13). SWI is a new technique that exploits the magnetic properties of iron content of tissues by using magnitude and phase images and would be a very sensitive imaging sequences, better elaborating putative iron distrubution or extent in the deep gray nuclei of patients with Parkinson's disease (Fig. 13).

Traumatic brain injury

SWI is helpful for the evaluation of traumatic brain injury, often associated with punctate hemorrhages in the deep subcortical white matter, which are not routinely visible on CT or conventional MR imaging sequences (Fig. 14). Study by Tong et al. (14) has shown that SWI has 3-6 times the sensitivity of conventional T2*GRE sequences for detecting the size, number, volume, and distribution of hemorrhagic lesions in DAI.

DISCUSSION

SWI is very useful in detecting neurovascular malformations such as DVA and cavernous malformation, in characterising brain tumors, in detecting cerebral microbleeds and in recognizing calcifications in various pathological conditions. The phase images are especially useful in differentiating between paramagnetic susceptibility effects of blood and diamagnetic effects of calcium. SWI can also be used to evaluate changes in iron content in neurodegenerative disorders and to predict stroke evolution.

Figures and Tables

Fig. 1
Phase (a), magnitude (b), combined SWI (c), and minIP SWI (d) showing the normal SWI intracranial appearances in a 61-year-old male. The cerebral parenchyma has intermediate signal intensity with white matter slightly hyperintense to gray matter. The lentiform nucleus (double arrow) and globus pallidi (arrow) (d) are low signal intensity due to mineral deposition.
jksmrm-18-290-g001
Fig. 2
minIP SWI showing the normal SWI intracranial appearances in 34-year-old (a) and 91-year-old males (b). The lentiform nucleus and globus pallidi are low signal intensity due to mineral deposition. This becomes more pronounced in a 91-year-old man compared with a 34-year-old man.
jksmrm-18-290-g002
Fig. 3
DVA in a 67-year-old female patient. mIP SWI demonstrating the typical curvilinear vascular channels receiving drainage from a spoke wheel-appearing collection of small, tapering veins (arrow) (a). Axial T2-weighted image shows a faint vascular lesions (arrow) (b).
jksmrm-18-290-g003
Fig. 4
Cavernous malformation in a 57-year-old female patient. Axial T2-weighted image shows focal central heterogeneous areas (arrow) corresponding to subacute-chronic hemorrhage, circumferential rings of markedly hypointense iron-storage forms around these high-intensity central areas, no mass effect or edema, and no demonstrable feeding arteries or draining veins associated with DVA (a). SWI has exquisite sensitivity for hemosiderin and calcification in theses lesions (arrow) (b). Cavernous malformation with DVA in a 58-year-old male patient. Axial T2-weighted image shows focal central heterogeneity containing areas (arrow) corresponding to subacute-chronic hemorrhage, circumferential complete rings of markedly hypointense iron-storage forms around these high-intensity central areas, no mass effect or edema (c). SWI shows draining veins associated with DVA (arrow) (d). Multiple cavernous malformations in a 80-year-old male patient. Axial T2-weighted image shows a tiny left temporal cavernous malformation (arrow) (e). GRE image shows multiple punctate low signal foci located in the both hemispheres that are not detected by T2-weighted image (arrows) (f). SWI shows supplemental cavernous malformations that are not detected by GRE (arrows) (g).
jksmrm-18-290-g004
Fig. 5
AVM in a 81-year-old male patient. Axial T2-weighted image demonstrates marked hypointensity (arrows) along the surface of the brain parenchyma or along the ependymal surface of the ventricle (a). SWI can demonstrate the tangle of arterial feeding vessels and the enlarged draining veins (arrow) (b).
jksmrm-18-290-g005
Fig. 6
Heavy falcine calcification in a 73-year-old male patient. Linear calcified mass (arrow) is identified in the falx by CT (a). The SWI filtered phase image with inverse contrast (b) shows the lesion (arrow) have opposite signal intensity to the veins along the sulci confirming that the dark area on the magnitude image (arrow) (c) is calcification. The location and size of the lesion shown on the SWI magnitude image matches the CT data.
jksmrm-18-290-g006
Fig. 7
Stroke with meningioma in a 67-year-old female patient. A 3.0 cm size enhancing extraaxial tumor (arrow) is seen in the left cavernous sinus area on contrast enhanced coronal T1-weighted image (a). Left distal internal carotid artery (ICA) narrowing and decreased blood flow of the left MCA are identified by brain TOF MR angiography (arrow) (b). T2-weighted image (c) shows no significant abnormal finding in the left MCA territory. Prominent veins in the left MCA territory, suggesting increased OEF, is seen on the minIP SWI (arrows) (d).
jksmrm-18-290-g007
Fig. 8
Lung adenocarcinoma brain metastasis in a 87-year-old male patient. A lobulated margin heterogenously enhancing metastasis in the left frontal lobe is seen on axial T1-weighted image (a). minIP SWI shows low signal hemorrhages within the tumor (arrow), and the edema has "T2 or FLAIR-like contrast" (b).
jksmrm-18-290-g008
Fig. 9
Renal cell carcinoma brain metastasis in a 65-year-old male patient. A tiny low signal intensity metastasis is seen on axial T2-weighted image in the left cerebellar hemisphere (a). Postcontrast T1-weighted image shows tiny rim enhancing metastasis in the left cerebellar hemisphere (b). mIP SWI shows prominent susceptibility lesion in the left cerebellar hemisphere (c) (arrows).
jksmrm-18-290-g009
Fig. 10
Meningioma in a 65-year-old female patient. A lobulated margin enhancing extraaxial tumor (arrow) is seen in the left cavernous sinus area on axial T1-weighted image (a), contrast enhanced axial T1-weighted image (b), T2-weighted image (c). Compared with axial SWI (d), a lobulated margin enhancing extraaxial tumor is seen in the left cavernous sinus area on contrast enhanced axial SWI (e). Internal vascular structure of a tumor that is not visible on T1-weighted image is well noted (arrows).
jksmrm-18-290-g010
Fig. 11
Lung adenocarcinoma brain metastasis in a 64-year-old male patient. A 4.3 cm diameter low signal metastasis is seen in the left parietal area on axial precontrast T1-weighted image (a). On postcontrast T1-weighted image, the lesion shows a strong enhancement in its margins and solid component (arrows) (b). The areas that do not enhance on postcontrast T1-weighted image, which likely correspond to necrosis, appear bright on T2-weighted image (c). On SWI precontrast, the margins of the lesion are clearly visible due to a thin hypointense rim (which supposedly represents capsule ) and well-visualized edema. Aggregated low signal foci are visible, which were interpreted to be hemorrhage (d). On postcontrast SWI, focal enhancement areas are seen, that suggests a breakdown of the blood brain barrier in the surrounding white matter (arrow). The conspicuity of the lesion is thus markedly increased (e).
jksmrm-18-290-g011
Fig. 12
Moyamoya disease in a 65-year-old male patient. Brain TOF MR angiography shows high grade stenosis of the both proximal MCAs (a). On FLAIR image, there is no signs of chronic or acute ischemia (b). minIP SWI shows increased conspicuity of deep medullary veins, known as "brush sign" (arrows) (c). On contrast enhanced PWI, there is increased mean transit time (MTT), time to peak (TTP) in the both MCA territories (d, e). On 3D-pulsed ASL PWI, compared with 30-year-old female normal control (f, hypoperfusion areas are noted in the both MCA territories (arrows) (g).
jksmrm-18-290-g012
Fig. 13
Parkinson's disease in a 85-year-old male patient. T2-weighted axial image shows no definite abnormal finding (a). GRE axial images (b, c) show prominent iron deposition of the bilateral globus pallidi, caudate nuclei, putamen, substantia nigra and red nuclei. Parkinson's disease in a 85-year-old male patient. Decreased density of dopamine transporters (DAT) in the bilateral mid-to-posterior putamen (arrows) using 123I-n-fluoropropyl-2b carbomethoxy-3b-(4-iodophenyl) nortropane (FP-CIT), which is a high-affinity cocaine analog that binds specifically to DATs on PET (d). minIP SWI axial image (e) shows more prominent iron deposition of the bilateral globus pallidi, caudate nuclei, putamen, substantia nigra and red nuclei than GRE images.
jksmrm-18-290-g013
Fig. 14
Traumatic brain injury in a 57-year-old female patient. No abnormality is seen in the right temporal area on FLAIR (arrow) (a). GRE (arrow) (b) and minIP SWI (arrow) (c) show focal cortical hemorrhage.
jksmrm-18-290-g014
Table 1
Number of Brain MRI Abnormalities Seen in Patients Underwent MR Examinations that Included SWI on a 3T MR Imager
jksmrm-18-290-i001

References

1. Reichenbach JR, Venkatesan R, Schillinger DJ, Kido DK, Haacke EM. Small vessels in the human brain: MR venography with deoxyhemoglobin as an intrinsic contrast agent. Radiology. 1997; 204:272–277.
2. Haacke EM, Mittal S, Wu Z, Neelavalli J, Cheng YC. Susceptibility-weighted imaging: technical aspects and clinical applications, part 1. AJNR Am J Neuroradiol. 2009; 30:19–30.
3. Wang D, Li WB, Wei XE, Li YH, Dai YM. An investigation of age-related iron deposition using susceptibility weighted imaging. PLoS One. 2012; 7:e50706. doi: 10.1371/journal.pone.0050706 Epub 2012 30.
4. Sehgal V, Delproposto Z, Haacke EM, et al. Clinical applications of neuroimaging with susceptibility weighted imaging. J Magn Reson Imaging. 2005; 22:439–450.
5. Sarwar M, McCormick W. Intracerebral venous angioma: case report and review. Arch Neurol. 1978; 35:323–325.
6. Kaplan HA, Aronson SM, Browder EJ. Vascular malformations of the brain. An anatomical study. J Neurosurg. 1961; 18:630–635.
7. Wu Z, Mittal S, Kish K, Yu Y, Hu J, Haacke EM. Identification of calcification with magnetic resonance imaging using susceptibility-weighted imaging: a case study. J Magn Reson Imaging. 2009; 29:177–182.
8. Santhosh K, Kesavadas C, Thomas B, Gupta AK, Thamburaj K, Kapilamoorthy TR. Susceptibility weighted imaging: a new tool in magnetic resonance imaging of stroke. Clin Radiol. 2009; 64:74–83.
9. Radbruch A, Graf M, Kramp L, et al. Differentiation of brain metastases by percentagewise quantification of intratumoral-susceptibility-signals at 3Tesla. Eur J Radiol. 2012; 81:4064–4068. doi: 10.1016/j.ejrad.2012.06.016 Epub 2012 12.
10. Sehgal V, Delproposto Z, Haddar D, et al. Susceptibility-weighted imaging to visualize blood products and improve tumor contrast in the study of brain masses. J Magn Reson Imaging. 2006; 24:41–51.
11. Horie N, Morikawa M, Nozaki A, Hayashi K, Suyama K, Nagata I. "Brush Sign" on susceptibility-weighted MR imaging indicates the severity of moyamoya disease. AJNR Am J Neuroradiol. 2011; 32:1697–1702. doi: 10.3174/ajnr.A2568 Epub 2011 28.
12. Thomas B, Somasundaram S, Thamburaj K, et al. Clinical applications of susceptibility weighted MR imaging of the brain -a pictorial review. Neuroradiology. 2008; 50:105–116.
13. Bartzokis G, Cummings JL, Markham CH, et al. MRI evaluation of brain iron in earlier- and later-onset Parkinson's disease and normal subjects. Magn Reson Imaging. 1999; 17:213–222.
14. Tong KA, Ashwal S, Holshouser BA, et al. Hemorrhagic shearing lesions in children and adolescents with posttraumatic diffuse axonal injury:improved detection and initial results. Radiology. 2003; 227:332–339.
TOOLS
Similar articles