

 PDF
PDF ePub
ePub Citation
 Print
Print


INTRODUCTION
Diffusion-weighted magnetic resonance imaging (DW-MRI) is a novel imaging technique that reflects microscopic water diffusion using a pair of strong diffusion gradients. It was developed to map the apparent diffusion coefficient (ADC) (1). Parallel to the development of DW-MRI, there have been advances in Dynamic contrast-enhanced MRI (DCE-MRI). Using the MRI signal and pharmacokinetic models, parameters such as the volume transfer constant of the contrast agent (Ktrans) and the extravascular extracellular volume fraction (ve) can be obtained. This allows a qualitative and quantitative evaluation of the angiogenic characteristics of tumors (2, 3, 4).
There have been many studies regarding the usefulness of ADC Values, Ktrans or ve in differentiating benign from malignant lesions in various organs (5, 6, 7, 8, 9, 10). The ADC value correlates inversely with tissue cellularity. Ktrans and ve can characterize tissue vasculature and are sensitive to differences in blood volume and vascular permeability that can be related to tumor angiogenesis (4, 11). While theoretically useful, there are no standard values that differentiate between lesions, resulting in significant overlap of malignant and benign lesions.
These parameters appear to be heavily influenced by extravascular extracellular space volume. The values may be related superficially. If there were no significant correlation, this lack of relationship would support the usefulness of a multi-parametric approach to diagnosis using MRI. The objective of this study was to investigate whether the quantitative parameters derived from DWI and DCE-MRI correlate in clinical situations.
MATERIALS AND METHODS
Patients
This retrospective study was conducted with an institutional review board-approved waiver of informed consent and was in compliance with HIPAA. From July 2011 to February 2012, 65 patients with a preliminary diagnosis of bone metastasis who were evaluated with pelvic bone or hip MRI were included in the study. Among them, those with a new diagnosis of a metastatic lesion without a history of chemotherapy or radiation were selected. Forty-one patients were excluded because of the previous treatment history, and 11 patients were excluded because of the MRI artifacts. Finally, 13 patients (6 females and 7 males) aged between 42 and 79 years (mean age, 58 years) with pathologically or clinically proven metastasis in the pelvic bones were included in our study. There were 6 lung cancer patients, 5 breast cancer patients, 1 prostate cancer patient, and 1 renal cell carcinoma patient. Among them, 15 metastatic lesions were evaluated. Two lesions were confirmed as metastatic lesions by biopsy. The others were considered metastatic lesions because they showed progression in size and number during the 6-month follow-up period.
MR imaging technique
All patients underwent either pelvic bone or hip MRI prior to initiating chemotherapy or radiation therapy. MRI was performed with a 3.0 T scanner (Intera Achieva 3.0 T, Philips Medical System, Best, the Netherlands) using a phased-array body coil. Conventional MR sequences including T1-weighted (T1W) and T2-weighted (T2W) axial and sagittal images, T1W coronal images, and fat saturated T2W sagittal images were completed before DCE-MRI.
DW-MRI was acquired with a single-shot spin-echo echo-planar imaging sequence in three orthogonal diffusion encoding directions, with three b values (0,400, and 1400 s/mm2), an FOV of 350 × 350 and an acquisition matrix of 128 × 180. SENSE parallel imaging (acceleration factor=2) and spectral presaturation with inversion recovery fat saturation were implemented to reduce image artifact. Subjects were allowed to breathe freely with no gating applied. The DWIs consisted of 20 transverse slices with a slice thickness of 5 mm (no slice gap) and TR/TE of 5000/62 ms for a total scan time of 2 minutes and 15 seconds.
DCE-MRI was obtained using a 3D fast-field echo sequence in the axial plane (TR/TE 1.9/0.9 ms, slice thickness 5 mm, no inter-slice gap, FOV = 350 × 350, acquisition matrix 128 × 180). With the same FOV and acquisition matrix as those used in DW-MRI, a matched voxel-by-voxel analysis was enabled. Before the injection of contrast material, four pre-contrast T1-FFE sequences (flip angle of 5°, 7.5°, 10°, 12.5°) were completed. Similar geometry was used in order to calculate baseline T1 maps for the axial 3D fast field echo sequence. Following enhancement, images were obtained immediately after a bolus injection of gadolinium DTPA (Gadoteric acid, Guerbet, Roissy CdG, France) at a rate of 3 mL/s with a dose of 0.1 mmol/kg, followed by a flush of 15 mL of normal saline. The DCE-MRI consisted of 100 dynamic images with a temporal resolution of 3 seconds completed over a period of 5 minutes.
Image analysis
ADC maps were automatically generated with the commercial diffusion-analysis software (Extended MR work space, version 2.6.3.1. Philips Healthcare) from DWI. Three b values (0, 400, and 1400 s/mm2) were used, and high b value of 1400 s/mm2 was chosen because a b value of around 1400 s/mm2 was reported to be optimal for imaging bone marrow according to the previous report (5).
To quantify the DCE-MRI data, all dynamic data were transferred to a personal computer workstation from the MRI operating console and analyzed using previously validated in-house software (12) written using MATLAB version 7.6 (MathWorks, Natick, MA, USA). The MR signal intensity was converted into an equivalent concentration of contrast agent using the variable flip angle method (13). Pharmacokinetic parameters (Ktrans and ve) were estimated using Tofts model (2):
where Ct(t) is the time dependence of the contrast agent (CA) concentration and Cp(t) is the concentration of CA in blood plasma, or the so called arterial input function (AIF). Arterial input functions were manually defined from an appropriate section that included the superficial femoral artery by applying this model. Data from each DCE-MRI study were fitted with equation (2) voxel-by-voxel to yield estimates of Ktrans and ve for each voxel. The voxel size was 1.367 × 1.367 × 5 mm for each MRI.
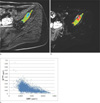
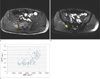
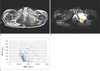
The regions of interest (ROIs) were manually drawn for each tumor by an experienced radiologist using MRIcro software (www.mricro.com). A slice with the largest area of enhancement was selected from the mid-phase image set (50 dynamic, at 3 minute) to prevent exclusion of delayed enhancing lesions. The margin of the enhancing area was drawn freehand. The lesion was then copied and pasted onto the ADC map to allow a matched, voxel-by-voxel evaluation using the same ROI. There are examples of ROI drawn in the ADC map and DCE-MRI images (Figure 1, 2, and 3).
Statistical Analysis
To calculate an overall correlation coefficient, the data from each patient were extracted voxel-by-voxel. For each parameter, the median value of the voxelbased analysis was calculated to yield one value for the entire lesion area for median value comparison. Scatterplots of Ktrans and ve with ADC were generated for both a voxel-by-voxel analysis and a comparison of median values. Statistical analysis was performed using the PASW statistical software (version 18.0; SPSS, Inc., Chicago, IL, USA). Scatterplots of ADC and Ktrans were generated for the voxel-by voxel analysis. Correlation and linear regression analysis of the ADC and Ktrans maps and ADC and ve maps were performed. We computed the Pearson correlation coefficient. P < 0.05 was considered significant.
RESULTS
Voxel-by-Voxel Analysis
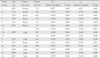
Fifteen metastatic lesions were detected in the 13 patients. All of the data from each patient was used to compute the overall correlation coefficient. The relationship between these parameters is summarized in Table 1. The Pearson correlation coefficients for ADC and Ktrans ranged from -0.534 to 0.579. Eleven lesions had statistically significant Pearson correlation coefficients. Among them, 7 lesions were inversely correlated while 4 lesions showed a positive correlation. The Pearson correlation values for ADC and ve ranged from -0.315 to 0.678. Nine of these lesions reached statistical significance with 4 lesions inversely related and 5 lesions positively related.
Comparison of Median Values
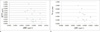
Group analysis was performed after averaging the individual voxels to yield one ADC, one Ktrans, and one ve value per patient. However, it did not yield a strong correlation either. Figure 4 demonstrates the scatterplot of median values of ADC versus Ktrans and ve, where the Pearson correlation value was -0.464 for Ktrans (p = 0.081) and -0.355 for ve (p = 0.194).
DISCUSSION
A lesion with a high Ktrans is likely an area of rapid proliferation and increased cell density, which would lead to a decreased ADC value. The ADC value is affected by the distribution of water between the intracellular space and the EES (14, 15, 16, 17). The measurement of ve from DCE-MRI is thought to reflect EES volume. Since these Ktrans, ve, and ADC parameters are influenced by the volume of the EES, therefore, one could assume that they also correlate to each other. This study combines the analysis of DCE-MRI data with ADC mapping in bony metastasis. However, contrary to what was expected, we were unable to identify a clear relationship between the ADC returned by the analysis of DW-MRI and the Ktrans and ve from DCE-MRI either by analyzing on a voxel-by-voxel basis or by comparison of median values.
MRI techniques have been developed that can noninvasively obtain an ADC value via DW-MRI. The ADC value describes the rate of diffusion in cellular tissues, which largely depends on the number and separation of barriers that a diffusing water molecule encounters in a specified time interval (18). This method is widely accepted in the clinical evaluation of tumors where the ADC value is often inversely correlated with tumor cell density (1).
The results of this study suggest that our current conceptual understanding of the above parameters is incomplete and simplistic. Furthermore, it suggests that multi-parametric MRI is necessary for an accurate evaluation of bony metastases. If one parameter is subordinate to the other parameter, current MRI protocols should be modified to reflect this hierarchy.
There are several possible explanations for our results. One potential issue is the way in which the ADC was measured. Many factors can influence measurements derived from DWI, such as the ADC. The magnitude, duration, and temporal separation of the matched gradients have an effect on the magnitude of the resulting signal intensity drop on ADC that occurs due to de-phasing and re-phasing gradients. Therefore, not only will the volume of the EES affect the calculated ADC values, but also the complexity and composition of the EES. The ADC values can also be affected by intrinsic tissue properties such as capillary bed perfusion, intracellular diffusion coefficients, membrane permeability, and exchange times (14, 19). ADC is further susceptible to patient factors including patient motion, incomplete fat suppression, artifacts from biopsy markers and susceptibilityinduced distortions (20).
DCE-MRI analysis is typically based on compartmental models whose requisite assumptions may not be always valid. For example, in some regions, the delivery of contrast agents may not rely entirely on vascular perfusion. Instead, some of the contrast agents may diffuse into the voxel or into the adjacent regions, a possibility not accounted for by compartmental models. Ve can be measured when contrast medium leaks from the vessels into the EES, but it is not possible to estimate ve when the tissue is not perfused or when no extravascular contrast leakage occurs. In other words, there may be a large number of voxels within each tumor with an unmeasurably low ve and a wide range of possible ADC values (14, 21).
There have been several studies comparing ADC and DCE-MRI parameters, but the results are variable. Arlinghaus et al. (20) and Mills et al. (14) reported that there was no statistically significant correlation between ADC and ve on either a voxel-by-voxel or ROI basis. On the other hand, Chu et al. (22) reported that Ktrans values were inversely correlated with ADC values (r = -0.536, P < 0.001) and Yankeelov et al. (17) reported that ADC and ve were negatively correlated (r = -0.60, P < 0.02). These diverse study results suggest that a conventional interpretation of the parameters or their relationship is not sufficient to explain these experimental findings.
There are several further intrinsic limitations to the present study. First, it is a retrospective study with a small sample size that could have been influenced by selection and verification biases. The small number of patients with adequate imaging and clinical data prevented us from reaching clinical significance. This limitation was unavoidable as patients with bony metastases are usually in terminal stages of their illness, making it difficult to obtain pathological or clinical confirmation of the diagnosis. In an attempt to minimize the limitations of our study, those who had MRI with artifacts were excluded. DW-MRI and DCE-MRI were not obtained simultaneously. Thus, there may have been a certain degree of motion artifact from the studies having been performed at different times. While these were unavoidable difficulties inherent to the study, they again compromised the number of potential subjects. Another limitation was that the patients included in this study had a variety of primary malignancies. Each metastatic lesion might express different characteristics based on the type of primary tumor, affecting the results of DWI or DCE-MRI. Further studies to assess these pathologic differences are warranted. Lastly, only malignant lesions were included in the study, so the study does not explore the role of ADC values, Ktrans or ve in differentiating malignancy from the benign lesions.
In conclusion, although ADC, Ktrans, and ve are believed to be affected by the distribution of water between the intracellular space and the extracellular space, the correlation between the parameters is not clear. The results of this study suggest that further investigation into the potential of multi-parametric MRI to provide information on water distribution and geometry in the tumor environment is warranted.
 XML Download