

 PDF
PDF ePub
ePub Citation
 Print
Print


INTRODUCTION
Developmental venous anomaly (DVA), which is also called venous angioma, is the most common cerebral vascular malformation (1, 2). DVA exhibits radially arranged, dilated veins (so-called caput medusae) that drain into an enlarged transcortical or a subependymal collecting vein (3). DVA is usually asymptomatic and it's often incidentally found on contrast-enhanced (CE) CT or MR imaging. Recent investigations have reported that parenchymal signal abnormality on T2/FLAIR MR imaging could be associated in 7.8-54.1% of DVAs (4, 5, 6). Most of the brain lesions usually show parenchymal signal abnormalities on T2/FLAIR MR imaging, CE study is needed for the characterization of the lesions. However, the CE study increases scan time and cost. Because the gadolinium MR contrast agent may also result in complications such as nephrogenic systemic fibrosis, the CE MR examination is contraindicated in patients with severe renal dysfunction (7). At many institutions, CE study is performed in the limited cases, in which neoplastic or inflammatory lesions are suspected. If we can detect most of the DVAs with MR sequences without CE, CE study may be omitted.
Susceptibility-weighted imaging (SWI) is a highly sensitive MR technique for the visualization of the cerebral veins and venous anatomy and it is also useful for the detection and demonstration of the prominent veins in various pathologic conditions (8, 9, 10, 11). By using paramagnetic deoxy-Hb in the cerebral veins as an intrinsic contrast agent, SWI can depict the normal cerebral veins and cerebral venous pathology (10, 12, 13). However, as we know, the usefulness of SWI for the demonstration of DVA was mentioned only in the pictorial essays or review articles and there has been no original article only for the DVAs.
The goal of this study was to evaluate the diagnostic value of SWI compared with T2-weighted and FLAIR images for the detection of DVA.
MATERIALS AND METHODS
Patients
Between January 2012 and December 2012, 1068 patients underwent brain MR examinations with SWI and contrast enhancement. With a retrospective review of their MR imaging, DVAs were identified in 28 patients (2.6%) on CE T1-weighted images. There were 17 males and 11 females, aged from 19 to 92 years (mean, 59.1 years). Sex and age-matched 28 patients without DVA were chosen as a control group [17 males and 11 females, aged from 19 to 92 years (mean, 59.1 years)].
MR imaging protocol
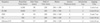
All MR examinations were performed at a 1.5 Tesla MR scanner (Magnetom Avanto, Siemens Medical solutions, Erlangen, Germany). MR protocol consisted of T2-weighted imaging, fluid-attenuated inversion recovery (FLAIR), T1-weighted imaging, SWI, and CE T1-weighted imaging, respectively (Table 1).
SWI was acquired by using a fully velocity-compensated (with gradient moment nulling in all three orthogonal directions), three-dimensional, GRE sequence with the following parameters: repetition time (TR) = 48 ms, echo time (TE) = 40 ms, flip angle (FA) = 15°, bandwidth = 80 kHz, slice thickness = 2 mm, with 64 slices in a single slab, matrix size = 256×168. The acquisition time was 3 minutes and 7 seconds with the use of iPAT factor 2. All images were obtained in the same axial plane. Subsequently, 2-mm minIP images were generated. The sequence, along with entire image processing, was automated on Siemens MR scanner platforms. The SWI and minIP images were uploaded and made available on the picture archiving and communication (PACS) system.
Image analysis
SWI, T2, and FLAIR images of the patients and control groups were analyzed by blinded readers on each type of sequences. All images were reviewed independently by two radiologists who were blinded to other MR imaging. In cases of discrepancy, two reviewers reached a consensus later. The diagnostic criteria of DVA were radially arranged, dilated veins that drain into an enlarged transcortical or a subependymal collecting vein.
RESULTS
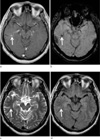
In the 28 patients group, 24 (85.7%) DVAs were in any lobes of the supratentorial brain and four (14.3%) were in the cerebellum.
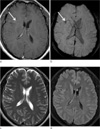
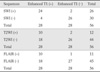
Among 28 DVAs, 24 (85.7%) were detected on SWI (Figs. 1, 2). In 28 control patients without DVA, SWI showed true negative in 26 (92.9%) and false positive in two (Table 2). T2-weighted images detected 10 (35.7%) of 28 DVAs (Fig. 2). Among 28 control patients, T2-weighted images showed true negative in 26 (92.9%). There were two false positive and two false negative cases for the detection of DVAs on T2-weighted images (Table 2). On the other hand, FLAIR images showed true positive in 10 (35.7%) (Fig. 2), false positive in one, true negative in 27 (96.4%), and false negative in 18, respectively (Table 2).
The sensitivity, specificity, PPV, and NPV of SWI for the detection of DVA were 85.7%, 92.9%, 92.3%, and 86.7%, respectively. T2 and FLAIR images showed sensitivity of 35.7% and 35.7%, specificity of 92.9% and 96.4%, PPV of 83.3% and 90.9%, NPV of 59.1% and 60.0%, respectively. On SWI, sensitivity and NPV for the detection of DVAs were significantly higher than those of T2 and FLAIR images (p < 0.05).
In the initial assessment for the detection of DVA, each reader showed the same result in 51 patients for T2, 48 for FLAIR, and 47 for SWI, respectively. Interobserver agreement rate between each reader was 91.1% for T2, 85.7% for FLAIR, and 83.9% for SWI, respectively.
DISCUSSION
Four categories are classified in the cerebral vascular malformations: arteriovenous malformation, capillary telangiectasia, DVA, and cavernous angioma (CA) (14, 15, 16). Of these, DVA is the most common, with a 2.6% incidence in 4069 brain autopsies (2). In our study, DVAs were demonstrated in 28 (2.6%) of 1068 patients, which is similar to those of the previous reports (2, 17).
In the present study, SWI sensitively detected DVA with high sensitivity (85.7%) and high specificity (92.9%). The sensitivity of SWI for the detection of DVA was superior to those of T2 and FLAIR images (35.7%, respectively) (Table 2). Regarding the specificity, all of SWI, T2 and FLAIR images showed high specificity (92.9%, 92.9%, and 96.4%, respectively) (Table 2). There have been several reports that SWI was used for the evaluation of cerebral vascular malformations. Several types of vascular malformations with slow venous flow are better visualized with SWI, including DVA, CA, and capillary telangiectasia (18, 19, 20). SWI is a high-spatial resolution, three-dimensional, gradient-echo (GRE) MR technique which maximizes sensitivity to magnetic susceptibility effects (12, 13). Deoxyhemoglobin (deoxy-Hb) in the cerebral vein, being paramagnetic with four unpaired electrons, generates magnetic fields that are additively combined with the external magnetic field (12, 13, 21). SWI uses paramagnetic deoxy-Hb in the cerebral vein as an intrinsic contrast agent, and it is useful for the demonstration of the cerebral venous anatomy (10, 12). Because DVA is a normal variation of the transmedullary vein, it usually shows similar flow velocity and deoxy-Hb concentration to the normal cerebral vein. On SWI, DVA is demonstrated as a signal void lesion with the normal cerebral veins (Figs. 1, 2).
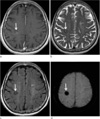
DVAs can be associated with CAs in 13% to 40% of cases in which CA is typically located in the region of the caput medusae (15, 22). CA is a low pressure and slow-flow vascular malformation associated with intralesional hemorrhages at various stages of evolution. On MR, a typical CA appears as a well circumscribed lesion of mixed signal intensity on T1- and T2-weighted sequences, with a hypointense rim corresponding to hemosiderin deposition and characteristic "blooming effect" resulting from the susceptibility dephasing effect caused by hemosiderin. According to the recent reports, SWI could sensitively detect CA compared to T2-weighted spin-echo and GRE images (23, 24). In our study, four CAs were associated within the region of DVAs (14.3%) and they were most prominently demonstrated on SWI (Fig. 3).
Although DVAs are usually asymptomatic and there was no symptomatic case in our study, DVAs can be symptomatic. A prospective study by McLaughlin et al. showed that symptomatic hemorrhagic risk was 0.34% per year in their patients with DVAs (25). Associated CAs may cause symptomatic hemorrhage. Ischemic or hemorrhage infarction is also associated with DVAs (15, 16, 17). Venous hypertension due to thrombosis or stenosis of the collecting vein is the underlying mechanism leading to symptomatic infarction or asymptomatic parenchymal signal abnormalities in DVAs. In cases of no demonstrable stenosis, partial thickening of the veins forming the DVA may also contribute to the development of venous hypertension by reducing the size and compliance of the vessel lumen, increasing the resistance to flow, and diminishing the vessel's capacity to adapt to pressure modifications (15). In a recent study that evaluated diffusion and perfusion-weighted MR imaging in patients with parenchymal signal abnormalities associated with DVAs, the signal abnormalities around DVAs showed increased ADC, increased cerebral blood volume, and delayed mean transit time and time-topeak to those of the contralateral normal portions, respectively. They concluded that the parenchymal signal abnormalities associated with DVA were caused by vasogenic edema with congestion and delayed perfusion (26). In our study. The parenchymal signal abnormalities in the DVA drainage area were associated in seven patients (25.0%), which is similar to those of the previous reports (4, 5, 6). Among the seven DVAs with parenchymal signal abnormalities, six (85.7%) were detected on SWI. We think that SWI has potential for the detection of DVAs in patients who have hemorrhagic lesions or parenchymal signal abnormalities associated with DVAs without CE study.
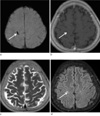
In our study, SWI showed false positive in two cases. In the retrospective review, a prominent normal cerebral vein was misdiagnosed as a DVA in one and a linear parenchymal hemorrhage in the other, respectively (Fig. 4).
Limitation of the present study is that there may have been selection and verification biases because our study was a retrospective study.
In conclusion, SWI was sensitive and specific for the detection of DVA.
 XML Download